Traditional application performance monitoring (APM) tools survey CPU, memory, p99 latency… and leave you to connect the dots. vFunction’s anomaly TODOs (i.e., tasks based on specific anomalous architecture events) are part of our broader product release. They flip the lens on typical APM monitoring by beginning with application behavior (flows, paths, errors and usage). The result? Early, architect-level alerts instead of dashboard noise.
These TODOs that detect anomalies introduce a new layer of architectural observability for distributed applications by detecting meaningful deviations in behavior like spikes in flow usage, misrouted paths, error surges and performance drops. Unlike traditional APMs that fixate on system-level metrics, vFunction starts with what matters most: application behavior. User experience, architectural health and early warning signals are all rooted in how flows behave not in raw CPU or memory numbers. By focusing first on behavioral anomalies and then correlating them with more signals like latency, vFunction delivers targeted, architecture-aware insights that surface real problems faster.
User experience, architectural health and early warning signals are all rooted in how flows behave not in raw CPU or memory numbers.
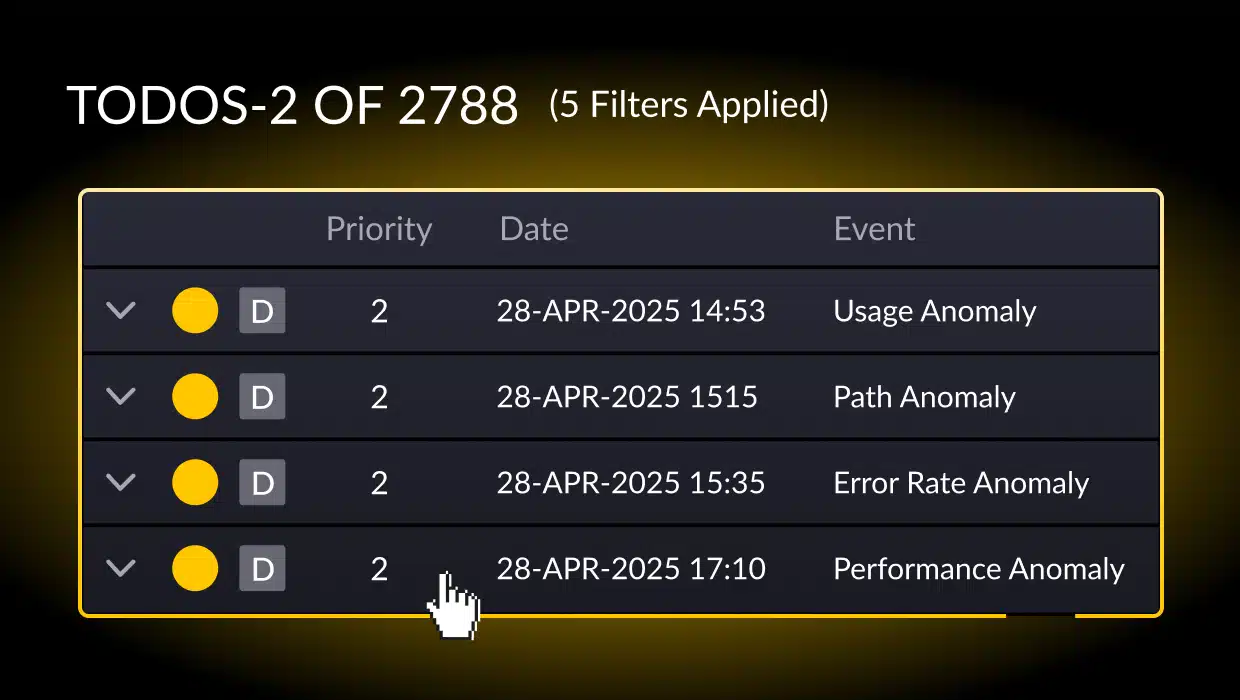
Every detected anomaly is surfaced as a TODO, an actionable, traceable and context-rich alert that helps architects and developers maintain quality and velocity. These TODOs integrate directly with tools like Jira and Azure DevOps, automatically opening tickets so anomalies are tracked, prioritized and resolved within your existing workflows.
Why use anomaly TODOs?
Early detection of architectural drift
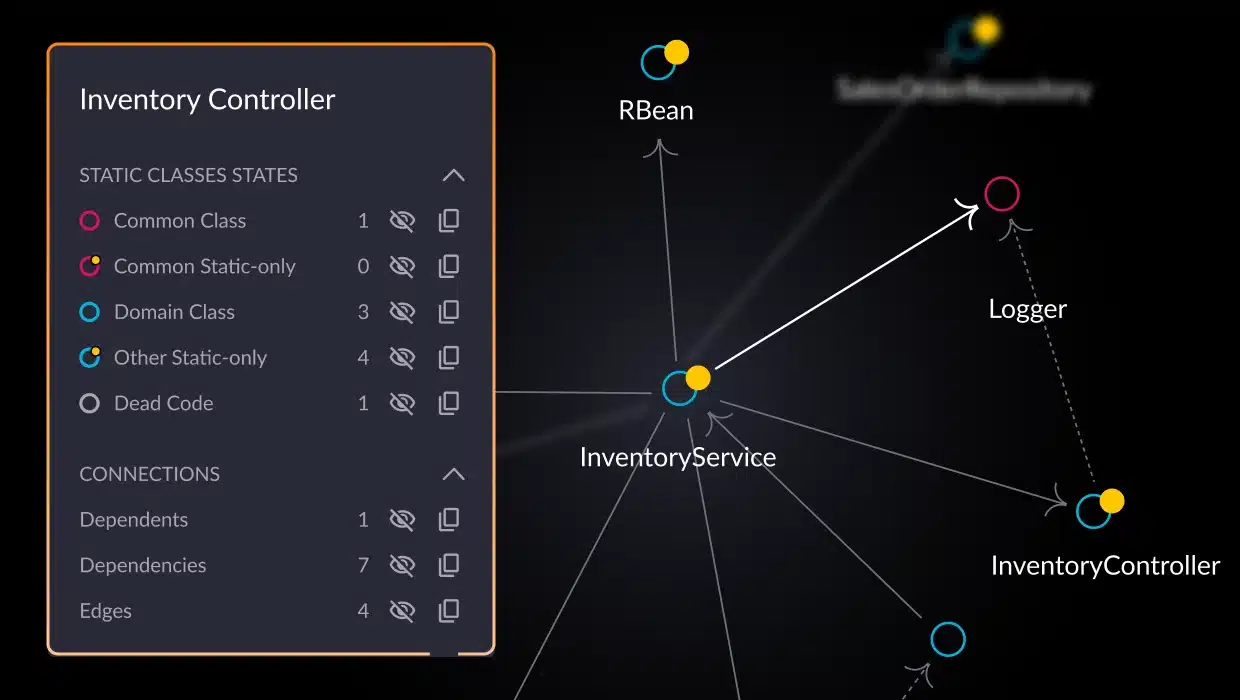
Catch issues while they’re still harmless or slow down delivery. If a once-isolated service suddenly leans on another microservice, this could indicate emerging coupling or a missed interface contract which are signs of architectural drift.
Actionable signals
Each anomaly is represented as a TODO, making it easy to investigate, track, assign and resolve directly from vFunction or your existing workflows by integrating with tools like Jira and Azure DevOps.
Four architecture anomalies
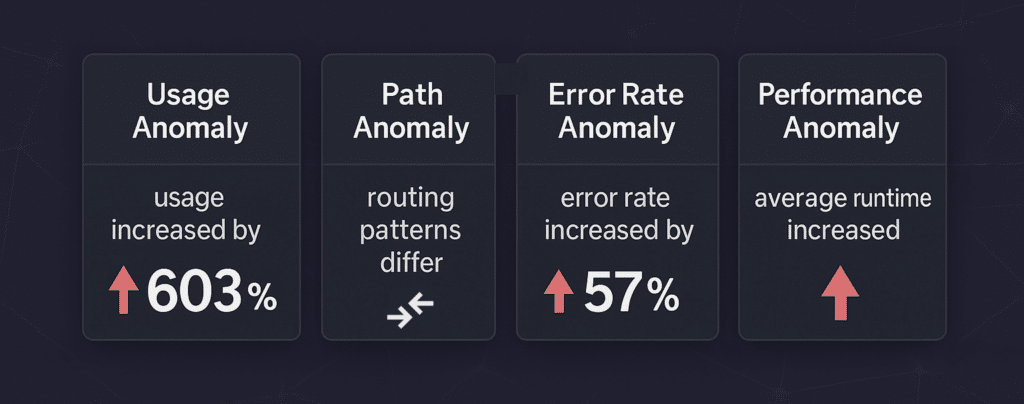
Let’s review four architecture anomalies now detected by vFunction TODOs.
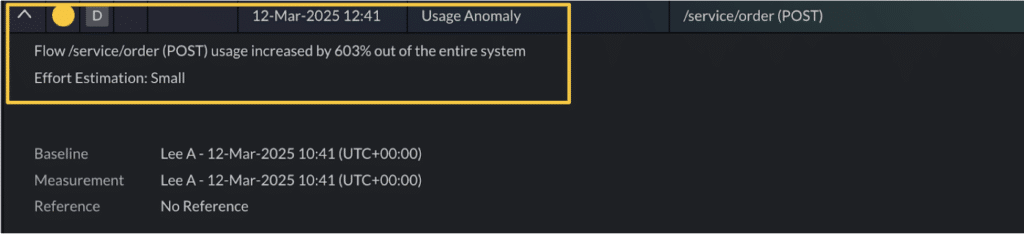
1. Usage anomaly — Behavioral changes in flow distribution
What it detects
A statistically significant spike or dip in calls to a specific flow (Z-score ≥ 3 on a baseline). These shifts are identified by analyzing historical flow activity and flagging deviations from established usage patterns.
Why it matters
Usage anomalies can surface silent UI changes, new feature rollouts, deprecated logic still being triggered or unexpected shifts in user behavior. Things that otherwise might get missed.
Why use it
- Validate feature adoption.
- Detect traffic misrouting or dead code.
- Confirm or investigate A/B test impact.
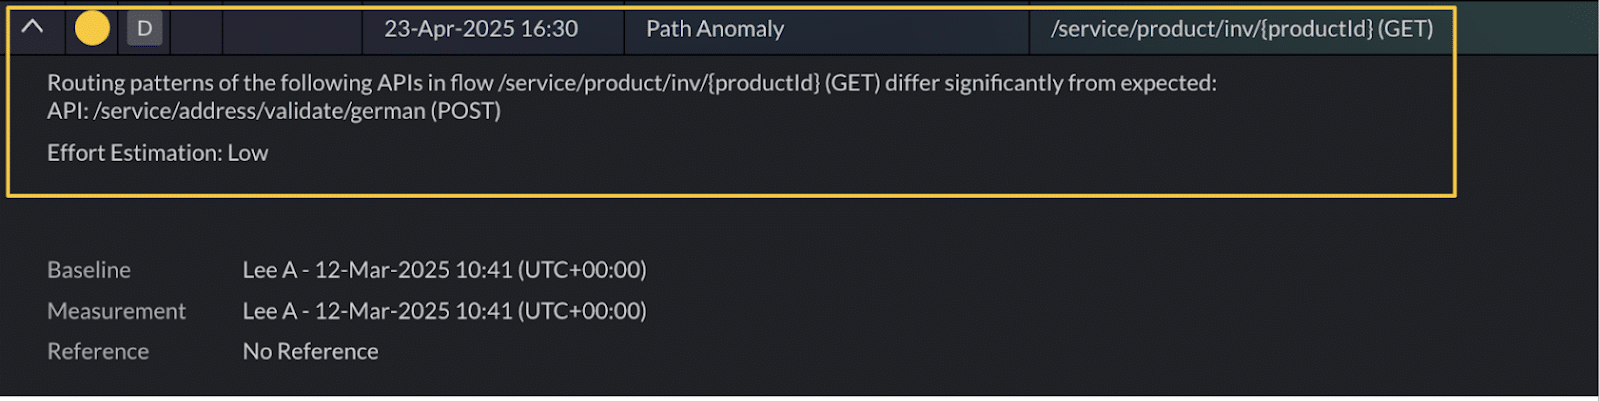
2. Path anomaly — Flow routing irregularities
What it detects
Significant deviations in internal flow behavior, such as calls being routed to unexpected endpoints or shifts in backend execution paths. These changes often signal deeper architectural or operational issues.
Why it matters
Path anomalies may point to architectural drift, routing bugs, unintended failover behavior, or misuse of caching layers issues that can quietly degrade system performance or reliability over time.
Why use it
- Identify unexpected path dominance or fallback logic.
- Catch misrouting caused by misconfigurations.
- Reveal hidden service coupling or brittle integrations.
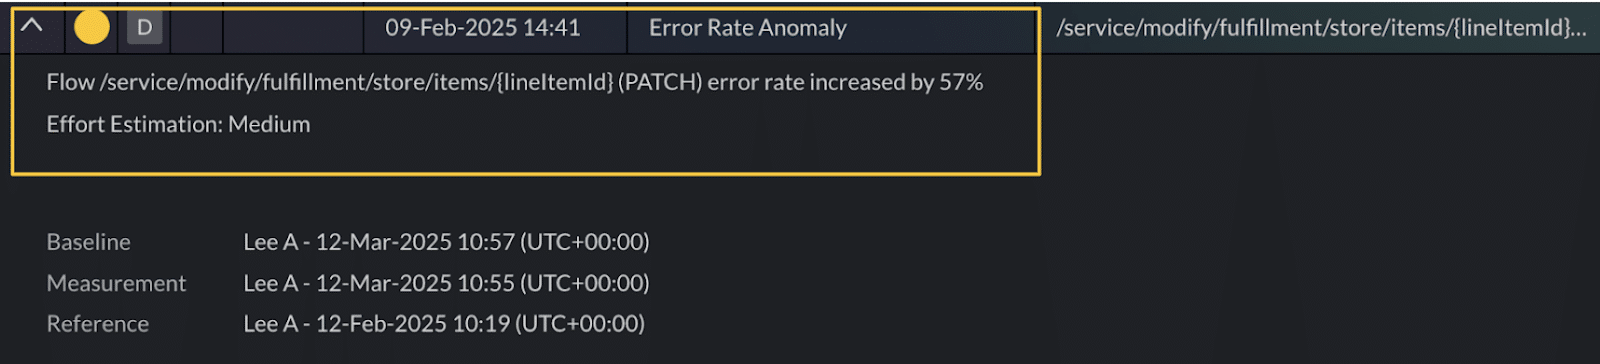
3. Error rate anomaly — Error spikes in flows
What it detects
A sudden surge in failed calls within a specific flow, flagged by analyzing error rate deviations from historical baselines.
Why it matters
These anomalies can reveal regressions, deployment issues, misconfigurations or outages even before users report them.
Why use it
- Catch critical issues early
- Pinpoint regressions linked to recent changes
- Accelerate root cause analysis
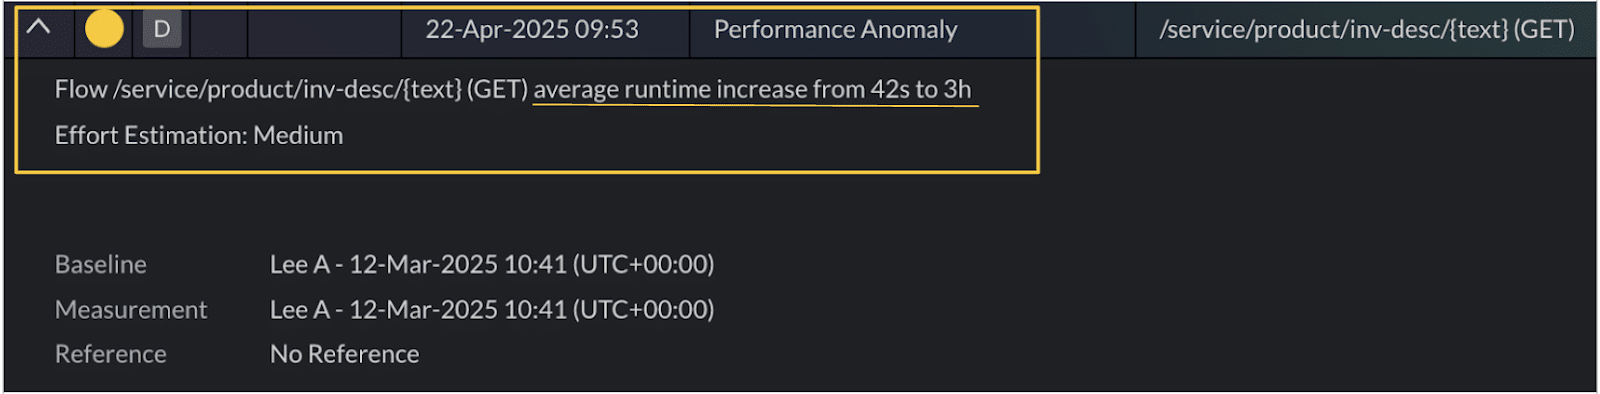
4. Performance anomaly — Latency and resource utilization spikes
What it detects
Unexpected spikes in flow response times or system resource usage like CPU and memory beyond the normal baseline operating variability.
Why it matters
These anomalies signal performance bottlenecks, inefficient code paths, overloaded infrastructure, or lagging third-party dependencies—issues that can quietly erode user experience and system stability.
Why use it
- Detect performance regressions in production
- Monitor the impact of code or infrastructure changes
- Proactively surface scalability limits before they hit users
Conclusion
vFunction’s TODOs for architecture anomalies act as a real-time early warning system for usage shifts, regressions and architectural drift. Rooted in behavior, not just raw metrics, they surface as actionable, context-rich tasks. That means faster diagnosis, confident decisions and resolution before issues spiral into technical debt.
Ready to stay ahead of application issues caused by anomalies? Contact us to see how vFunction’s new anomaly detection TODOs help you spot issues early, take decisive action, and keep your applications resilient and scalable.