As applications grow more complex to meet increasing demands for functionality and performance, understanding how they operate is critical. Modern architectures—built on microservices, APIs, and cloud-native principles—often form a tangled web of interactions, making pinpointing bottlenecks and resolving latency issues challenging. OpenTelemetry tracing provides greater visibility for developers and DevOps teams to understand the performance of their services and quickly diagnose issues and bottlenecks. This data can also be used for other critical applications, which we’ll incorporate into our discussion.
This post will cover all the fundamental aspects of OpenTelemetry tracing, including best practices for implementation and hands-on examples to get you started. Whether you’re new to distributed tracing or looking to improve your existing approach, this guide will give you the knowledge and techniques to monitor and troubleshoot your applications with OpenTelemetry. Let’s get started!
What is OpenTelemetry tracing?
OpenTelemetry, from the Cloud Native Computing Foundation (CNCF), has become the standard for instrumenting cloud-native applications. It provides a vendor-neutral framework and tools to generate, collect, and export telemetry consisting of traces, metrics, and logs. This data gives you visibility into your application’s performance and behavior.
Key concepts of OpenTelemetry
At its core, OpenTelemetry revolves around a few fundamental concepts, which include:
- Signals: OpenTelemetry deals with three types of signals: traces, metrics, and logs. Each gives you a different view of your application’s behavior.
- Traces: The end-to-end journey of a single request through the many services within your system.
- Spans: These are individual operations within a trace. For example a single trace might have spans for authentication, database access and external API calls.
- Context propagation: The mechanism for linking spans across services to give you a single view of the request’s path.
Within this framework, OpenTelemetry tracing focuses on understanding the journey of requests as they flow through a distributed system. Conceptually, this is like creating a map of each request path, encapsulating every single step, service interaction, and potential bottleneck along the way.
Why distributed tracing matters
Debugging performance issues in legacy, monolithic applications was relatively easy compared to today’s microservice applications. You could often find the bottleneck within these applications by looking at a single codebase and analyzing a single process; but with the rise of microservices, where a single user request can hit multiple services, finding the source of latency or errors is much more challenging.
For these more complex systems, distributed tracing cuts through this noise. This type of tracing can be used for:
- Finding performance bottlenecks: Trace where requests slow down in your system.
- Error detection: Quickly find the root cause of errors by following the request path.
- Discovering service dependencies: Understand how your services interact and where to improve.
- Capacity planning: Get visibility into resource usage and plan for future scaling.
Combining these basic building blocks builds the core functionality and insights from OpenTelemetry. Next, let’s examine how all of these components work together.
How OpenTelemetry tracing works
OpenTelemetry tracing captures the flow of a request through your application by combining instrumentation, context propagation, and data export. Here’s a breakdown:
Spans and traces
A user clicks a button on your website. This triggers a request that hits multiple services: authentication, database lookup, payment processing, etc. OpenTelemetry breaks this down into spans, or units of work in distributed tracing, representing a single operation or a piece of a process within a larger, distributed system. Spans help you understand how requests flow through a system by capturing critical performance and context information. In the example below, we can see how this works, including a parent span (the user action) and a child span corresponding to each sub-operation (user authentication) originating from the initial action.
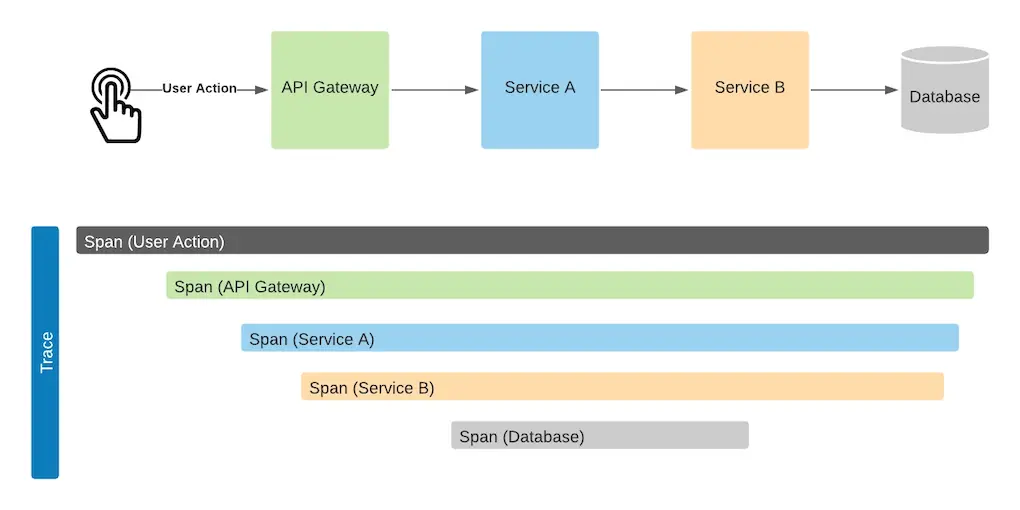
Within a span, there are span attributes. These attributes include the following:
- Operation name (e.g. “database query”, “API call”)
- Start and end timestamps
- Status (success or failure)
- Attributes (additional context like user ID, product ID)
One or multiple spans are then linked together to form a trace, giving you a complete end-to-end view of the request’s path. The trace shows you how long each operation took, where the latency was, and the overall flow of execution.
Context propagation
So, how does an OpenTelemetry link a span across services? This is where context propagation comes in. Conceptually, we can relate this to a relay race. Each service is handed a “baton” with trace information when it receives a request. This baton, metadata contained in headers, allows the service to create spans linked to the overall trace. As the request moves from one service to the next, the context is propagated, correlating all the spans.
To implement this, OpenTelemetry uses the W3C Trace Context standard for context propagation. This standard allows the trace context to be used across different platforms and protocols. By combining spans and traces with context propagation, OpenTelemetry gives users a holistic and platform-agnostic way to see the complex interactions within a distributed system.
Getting started with OpenTelemetry tracing
With the core concepts covered, let’s first look at auto-instrumentation. Auto-instrumentation refers to the ability to add OpenTelemetry tracing to your service without having to modify your code or with very minimal changes. While it’s also possible to implement OpenTelemetry by leveraging the OpenTelemetry SDK and adding tracing to your code directly (with some added benefits), the easiest way to get started is to leverage OpenTelemetry’s auto-instrumentation for a “zero-code” implementation.
What is auto-instrumentation?
For those who don’t require deep customization or want to get OpenTelemetry up and running quickly, auto-instrumentation should be considered. Auto-instrumentation can be implemented in a number of ways, including through the use of agents that can automatically instrument your application without code changes, saving time and effort. The way it’s implemented depends on your specific development language / platform.
The benefits of running auto-instrumentation include:
- Quick setup: Start tracing with minimal configuration.
- Comprehensive coverage: Automatically instrument common libraries and frameworks.
- Reduced maintenance: Less manual code to write and maintain.
To show how easy it is to configure, let’s take a brief look at how you would implement auto-instrumentation in Java.
How to implement auto-instrumentation in Java
First, download the OpenTelemetry Agent, grabbing the opentelemetry-javaagent.jar from the OpenTelemetry Java Instrumentation page.
Once the agent is downloaded, you will need to identify the parameters needed to pass to the agent so that the application’s OpenTelemetry data can be exported properly. The most basic of these would be:
- Export endpoint – The server endpoint where all the telemetry data will be sent for analysis.
- Protocol – The protocol to be used for exporting the telemetry data. OpenTelemetry supports several different protocols, but we’ll be selecting http/protobuf for this example
Exporting will send your telemetry data to an external service for analysis and visualization. Some of the popular platforms include Jaeger and Zipkin and managed services such as Honeycomb or Lightstep.
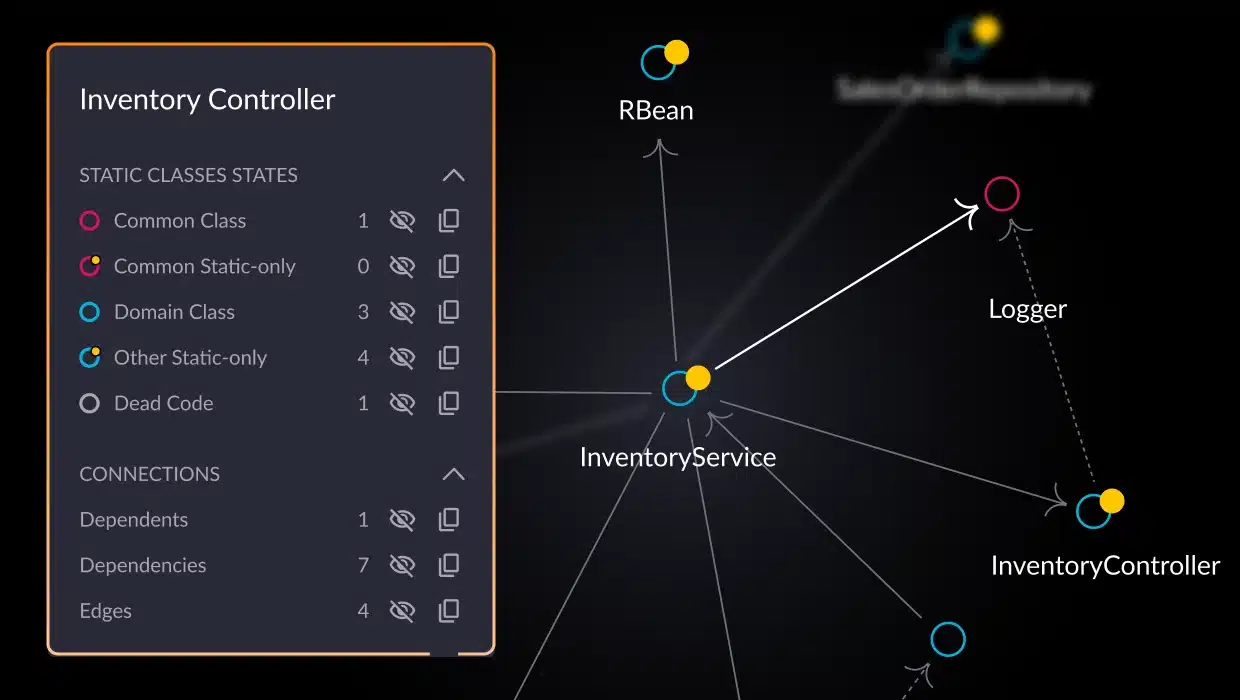
While these platforms are great for visualizing traces and finding performance bottlenecks, vFunction complements this by using this same tracing data to give you a deeper understanding of your application architecture. vFunction will automatically analyze your application traces and generate a real-time architecture map showing service interactions and dependencies as they relate to the application’s architecture, not its performance. This can help developers and architects identify potential architectural issues that might cause performance problems that are identified within the other OpenTelemetry tools being used.
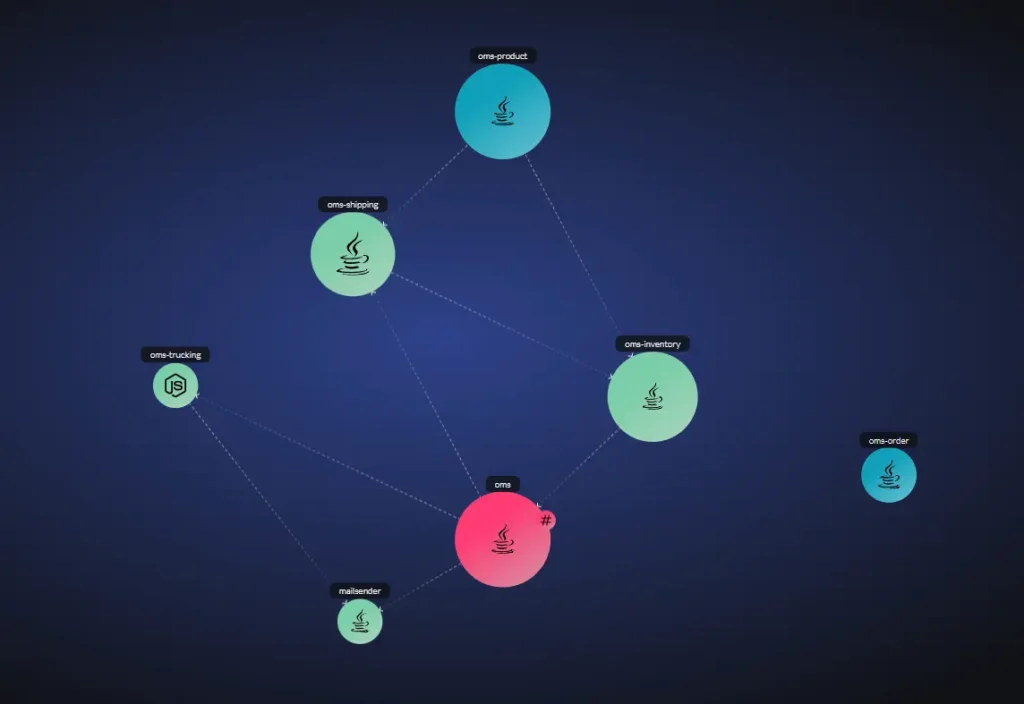
Once you have the settings needed for exporting, you can run your application with the agent. That command will look like this:
java -javaagent:path/to/opentelemetry-javaagent.jar -jar myapp.jar
-Dotel.exporter.otlp.protocol=http/protobuf
-Dotel.exporter.otlp.endpoint=https://opentelemetryserver
In the command, you’ll need to replace path/to/ with the actual path to the agent JAR file and myapp.jar with your application’s JAR file. Additionally, the endpoint would need to be changed to an actual endpoint capable of ingesting telemetry data. For more details, see the Getting Started section in the instrumentation page’s readme.
As you can see, this is a simple way to add OpenTelemetry to your individual services without modification of the code. If you choose this option, ensure that you understand and have confirmed the compatibility between the auto-instrumentation agent and your application and that the agent supports your application’s libraries. Another consideration revolves around customization. Sometimes auto-instrumentation does not support a library you’re using or is missing data that you require. If you need this kind of customization, then you should consider updating your service to use the OpenTelemetry SDK directly.
Updating your service
Let’s look at what it takes to manually implement OpenTelemetry tracing in a simple Java example. Remember, the principles apply across any of the different languages within which you could implement OpenTelemetry.
Setting up a tracer
First, you’ll need to add the OpenTelemetry libraries to your project. For Java, you can include the following dependencies in your pom.xml (Maven) or build.gradle (Gradle) file:
<dependency>
  <groupId>io.opentelemetry</groupId>
  <artifactId>opentelemetry-api</artifactId>
  <version>1.26.0</version>
</dependency>
<dependency>
  <groupId>io.opentelemetry</groupId>
  <artifactId>opentelemetry-sdk</artifactId>
  <version>1.26.0</version>
</dependency>
<dependency>
  <groupId>io.opentelemetry</groupId>
  <artifactId>opentelemetry-exporter-otlp</artifactId>
  <version>1.26.0</version>
</dependency>
Next, your code will need to be updated to initialize the OpenTelemetry SDK within your application and create a tracer:
import io.opentelemetry.api.GlobalOpenTelemetry;
import io.opentelemetry.api.OpenTelemetry;
import io.opentelemetry.api.trace.Tracer;
import io.opentelemetry.exporter.otlp.trace.OtlpGrpcSpanExporter;
import io.opentelemetry.sdk.OpenTelemetrySdk;
import io.opentelemetry.sdk.trace.SdkTracerProvider;
import io.opentelemetry.sdk.trace.export.BatchSpanProcessor;


public class MyApplication {


    public static void main(String[] args) {
        // Configure the OTLP exporter to send data to your backend
        OtlpGrpcSpanExporter otlpExporter = OtlpGrpcSpanExporter.builder().build();


        SdkTracerProvider tracerProvider = SdkTracerProvider.builder()
                .addSpanProcessor(BatchSpanProcessor.builder(otlpExporter).build())
                .build();


        OpenTelemetrySdk openTelemetrySdk = OpenTelemetrySdk.builder()
                .setTracerProvider(tracerProvider)
                .buildAndRegisterGlobal();


        // Create a tracer
        Tracer tracer = openTelemetrySdk.getTracer("my-instrumentation-library");


        // ... your application code ...
    }
}
This code snippet initializes the OpenTelemetry SDK with an OTLP exporter. Just like with auto-instrumentation, this data will be exported to an external system for analysis. The main difference is that this is configured here in code, rather than through command-line parameters.
Instrumentation basics
With the tracer set up, it’s time to get some tracing injected into the code. For this, we’ll create a simple function that simulates a database query, as follows:
import io.opentelemetry.api.trace.Span;
import io.opentelemetry.api.trace.StatusCode;
import io.opentelemetry.context.Scope;5


public void queryDatabase(String query) {
    Span span = tracer.spanBuilder("database query").startSpan();
    try (Scope scope = span.makeCurrent()) {
        // Simulate database operation
        Thread.sleep(100);
        span.setAttribute("db.statement", query);
        span.setStatus(StatusCode.OK);
    } catch (Exception e) {
        span.setStatus(StatusCode.ERROR, "Error querying database");
    } finally {
        span.end();
    }
}
This code does a few things that are applicable to our OpenTelemetry configuration. First, we use tracer.spanBuilder(“database query”).startSpan() to create a new span named “database query.” Then, we use span.makeCurrent() to ensure that this span is active within the try block.
Within the try block, we use Thread.sleep() to simulate a database command. Then we add a span.setAttribute(“db.statement”, query) to record the query string and set the span.setStatus to OK if successful. If the operation causes an error, you’ll see in the catch block that we call span.setStatus again, passing it an error to be recorded. Finally, span.end() completes the span.
In our example above, this basic instrumentation captures the execution time of the database query and provides context within the query string and status. You can use this pattern to manually instrument various operations in your application, such as HTTP requests, message queue interactions, and function calls.
Leveraging vFunction for architectural insights
Combining the detailed traces from OpenTelemetry implementation like the one above with vFunction’s architectural analysis gives you a complete view of your application’s performance and architecture. For example, if you find a slow database query through OpenTelemetry, vFunction can help you understand the service dependencies around that database and potentially reveal architectural bottlenecks causing the latency.
To integrate OpenTelemetry tracing data with vFunction:
1. Configure the OpenTelemetry collector:
NOTE: If you’re not using a collector, you can skip this step and send the data directly to vFunction
- – Configure the OpenTelemetry Collector to export traces to vFunction.
- Example configuration collector:
extensions:
  health_check:
  headers_setter:
    headers:
      - action: insert
        key: X-VF-APP
        from_context: X-VF-APP
receivers:
  otlp:
    protocols:
      grpc:
        endpoint: 0.0.0.0:4317
      http:
        endpoint: 0.0.0.0:4318
        include_metadata: true
processors:
  batch:
    metadata_keys:
    - X-VF-APP
exporters:
  otlphttp/vf:
    endpoint: $PROTOCOL://$VFSERVER/api/unauth/otlp
    auth:
      authenticator: headers_setter
service:
  extensions: [health_check, headers_setter]
  pipelines:
    traces:
      receivers: [otlp]
      processors: [batch]
      exporters: [otlphttp/vf]
2. Configure your service to include the required vFunction trace headers:
Each service that should be considered for the analysis needs to send its trace data to either vFunction or the collector. As part of this, a trace header must be added to help vFunction know with which distributed application this service is associated. After creating the distributed application in the vFunction server UI, it provides instructions on how to export telemetry data to the collector or vFunction directly. One way this can be done is via the Java command line:
-javaagent:<path-to-opentelemetry-javaagent.jar>
-Dotel.exporter.otlp.protocol=http/protobuf
-Dotel.exporter.otlp.endpoint=http://opentelemetrycollector:4318
-Dotel.traces.exporter=otlp
-Dotel.metrics.exporter=none
-Dotel.logs.exporter=none
-Dotel.exporter.otlp.traces.headers=X-VF-APP=<app header UUID>,X-VF-TAG=<env>
Other examples are provided in the server UI. The <app header UUID> above refers to a unique ID that’s provided in the vFunction server UI to associate a service with the application. The ID can be easily found by clicking on the “Installation Instructions” in the server UI and following the instructions.
3. Verify the integration:
– Generate some traces in your application.
– Check the vFunction server UI, and you should see the number of agents and tags increase as more services begin to send telemetry information. Click on “START” at the bottom of the interface to begin the analysis of the telemetry data. As data is received, vFunction’s UI will begin to visualize and analyze the incoming trace data.
By following these steps and integrating vFunction with your observability toolkit, you can effectively instrument your application and gain deeper insights into its performance and architecture.
Best practices for OpenTelemetry tracing
Implementing OpenTelemetry tracing effectively involves more than just adding instrumentation. As with most technologies, there are good, better, and best ways to implement OpenTelemetry. To get the full value from your tracing data, follow these best practices Consider the following key points when implementing and utilizing OpenTelemetry in your applications:
Semantic conventions
Adhere to OpenTelemetry’s semantic conventions for naming spans, attributes, and events. Consistent naming ensures interoperability and makes it easier to analyze traces.
For example, if you are creating a span for an HTTP call, add all of the relevant details to the span attributes and attribute the key-value pairs of information to the span. This might look something like this:
span.setAttribute("http.method", "GET");
span.setAttribute("http.status_code", 200);
The documentation on the OpenTelemetry website provides a detailed overview of the recommended semantic conventions, which are certainly worth exploring.
Efficient context propagation
Use efficient context propagation mechanisms to link spans across services with minimal overhead. OpenTelemetry supports various propagators, such as W3C TraceContext, the default propagator specification used with OpenTelemetry.
To configure the W3C TraceContext propagator in Java, do the following:
GlobalOpenTelemetry.setPropagators(
    ContextPropagators.create(W3CTraceContextPropagator.getInstance())
);
If you want to bridge outside of the default value, the OpenTelemetry docs on context propagation have extensive information to review, including the Propogators API.
Tail-based sampling
When it comes to tracing, be aware of different sampling strategies that can help to manage data volume while retaining valuable traces. One method to consider is tail-based sampling, which makes sampling decisions after a trace is completed, allowing you to keep traces based on specific characteristics like errors or high latency.
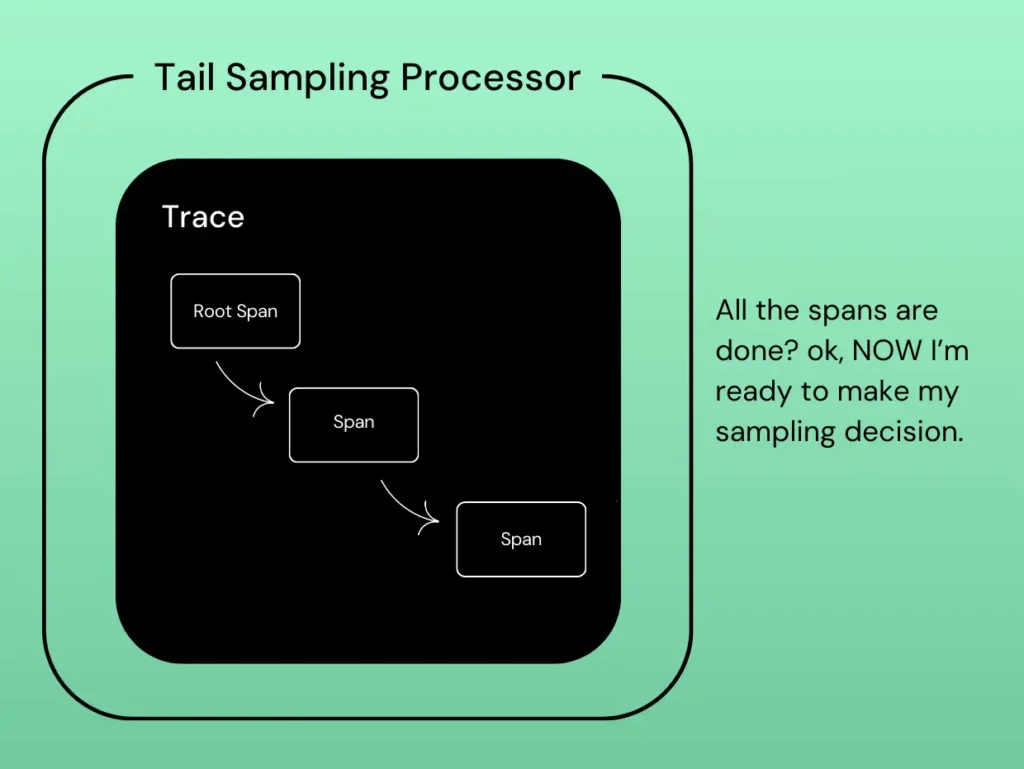
To implement tail-based sampling, you can configure it in the OpenTelemetry Collector or directly in the backend. More information on the exact configuration can be found within the OpenTelemetry docs on tail-based sampling.
Adhering to these best practices and incorporating auto-instrumentation as appropriate can enhance the efficiency and effectiveness of your OpenTelemetry tracing, yielding valuable insights into your application’s performance.
Troubleshooting and optimization
Although OpenTelemetry provides extensive data, effectively troubleshooting and optimizing your application requires understanding how to leverage this information. Here are strategies for using traces to identify and resolve issues:
Recording errors and events
When an error occurs, you need to capture relevant context. OpenTelemetry allows you to record exceptions and events within your spans, providing more information for debugging.
For example, in Java you can add tracing so that error conditions, such as those caught in a try-catch statement, can be captured correctly. For example, in your code, it may look something like this:
try {
    // ... operation that might throw an exception ...
} catch (Exception e) {
    span.setStatus(StatusCode.ERROR, e.getMessage());
    span.recordException(e);
}
This code snippet sets the span status to ERROR, records the exception message, and attaches the entire exception object to the span. Thus, you can see not only that an error occurred but also the specific details of the exception, which can be extremely helpful in debugging and troubleshooting. You can also use events to log important events within a span, such as the start of a specific process, a state change, or a significant decision point within a branch of logic.
Performance monitoring with traces
Traces are also invaluable for identifying performance bottlenecks. By examining the duration of spans and the flow of requests, you can pinpoint slow operations or services causing performance issues and latency within the application. Most tracing backends that work with OpenTelemetry already provide tools for visualizing traces, filtering by various criteria (e.g., service, duration, status), and analyzing performance metrics.
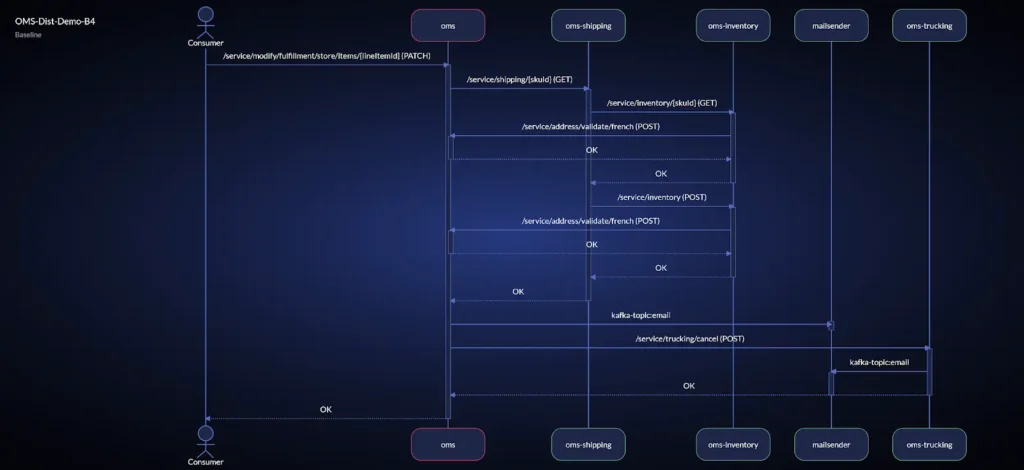
vFunction uses OpenTelemetry tracing to reveal the complexity behind a single user request, identifying overly complex flows and potential bottlenecks, such as the OMS service (highlighted in red), where all requests are routed through a single service.
vFunction goes beyond performance analysis, by correlating trace data with architectural insights. For example, if you identify a slow service through OpenTelemetry, vFunction can help you understand its dependencies, resource consumption, and potential architectural bottlenecks contributing to the latency, providing deep architectural insights that traditional performance-based observability tools don’t reveal.
Pinpoint and resolve issues faster
By combining the detailed information from traces with vFunction’s architectural analysis, you can reveal hidden dependencies, overly complex flows, and architectural anti-patterns that impact the resiliency and scalability of your application. Pulling tracing data into vFunction to support deeper architectural observability, empowers you to:
- Isolate the root cause of errors: Follow the request path to identify the service or operation that triggered the error.
- Identify performance bottlenecks: Pinpoint slow operations or services that are causing delays.
- Understand service dependencies: Visualize how services interact and identify potential areas for optimization.
- Verify fixes: After implementing a fix, use traces to confirm that the issue is resolved and performance has improved.
OpenTelemetry tracing, combined with the analytical capabilities of platforms like vFunction, empowers you to troubleshoot issues faster and optimize your application’s performance more effectively.
Next steps with vFunction
OpenTelemetry tracing provides a powerful mechanism for understanding the performance and behavior of your distributed applications. By instrumenting your code, capturing spans and traces, and effectively analyzing the data, you can identify bottlenecks, troubleshoot errors, and optimize your services.


