

In 2025, the massive wave of changes in the software landscape continues to grow. Cloud native architectures, microservices, serverless functions, and AI have created huge shifts and unprecedented opportunities, complexity, and risk. Understanding what’s happening inside these intricate systems when things go wrong, or even when they operate as expected, is harder than ever. Traditional monitoring, which relies on predefined dashboards and alerts, can tell you that a problem exists, but struggles to tell you why.
This is where software observability comes in. More than just monitoring 2.0, observability is the ability to infer the internal state and health of complex systems by analyzing the data they produce in the form of logs, metrics, and traces. These logs, metrics, and traces are known as external outputs, which observability tools analyze to gain insights into the internal system state. In this blog, we will cover everything you need to know about software observability tools and the best ones to add to your stack. Let’s get started by digging a bit further into what observability is.
What is observability in software systems?
At its core, software observability is the ability to measure and infer the internal state of a complex system based solely on the data it produces. The term comes from control theory, where it describes understanding a system by observing its external signals. In the context of modern software, especially distributed systems like microservices running in the cloud, observability means having the tools and data to understand why something is happening, not just that it’s happening (a staple of more traditional monitoring).
Observability is more than just collecting data from within an application; it’s about implementing high-quality, contextualized telemetry that allows you to explore behavior and performance effectively. Traditionally, observability has “three pillars”:
- Logs: These are discrete, timestamped records of events that occurred over time. Logs provide detailed, context-rich information about specific occurrences, such as errors, warnings, application lifecycle events, or individual transaction details. They are essential in most apps for troubleshooting issues and tracking the steps that lead to a problem.
- Metrics: Metrics are numerical representations of system health and performance measured over time. Think CPU utilization, memory usage, request latency, error rates, or queue depth. Metrics are usually aggregated so they can be easily assessed in dashboards, used for alerting on predefined thresholds, and understanding trends and overall system behavior.
- Traces: Traces track the end-to-end journey of a single request or transaction as it flows through multiple services in a distributed system. Each step in the journey (a “span”) contains timing and metadata. Traces are key for visualizing request flows, identifying bottlenecks, and understanding inter-service dependencies. They can also be very helpful in diagnosing latency issues in microservices architecture and highly complex systems with a lot of moving parts.
While these three pillars (metrics, logs, and traces) are the foundation, the ultimate goal of combining them is to give teams the visibility to ask any question about their system’s behavior, especially the “unknown unknowns” or emergent issues that teams couldn’t have predicted, and get answers quickly.
Observability vs. traditional monitoring
While related, observability and traditional monitoring serve distinct purposes in understanding software systems. Monitoring typically involves tracking predefined metrics to check system health, whereas observability enables deeper exploration to understand why systems behave the way they do, especially when encountering unexpected issues. Monitoring is often a component that feeds into a broader observability strategy. A traditional monitoring solution focuses on collecting and analyzing preset data and generating alerts based on known thresholds, while observability tools gather all generated data for a more comprehensive view.
Here’s a breakdown of the key differences:
| Comparison aspect | Traditional monitoring | Software observability |
| Primary goal | Health/status checking; alerting on known thresholds | Deep understanding; Debugging unknown & complex issues |
| Approach | Uses predefined metrics, dashboards, and alerts | Exploratory analysis using rich, correlated telemetry |
| Question focus | Answers predefined questions (“Is CPU usage high?”) | Enables asking arbitrary questions (“Why is this slow?”) |
| Problem handling | Addresses “Known unknowns” (anticipated failures) | Uncovers “Unknown unknowns” (unpredictable failures) |
| Core data types | Primarily metrics, basic logs | Correlated logs, metrics, traces (and often more) |
| System suitability | Effective for simpler, monolithic systems | Essential for complex, distributed systems (microservices) |
| Outcome | Identifies that a problem exists | Helps understand why a problem exists and its context |
| Nature | Often reactive (responds to threshold breaches) | Enables proactive investigation & hypothesis testing |
When comparing the two, you can think of monitoring as the dashboard warning lights in your car: they tell you if something pre-determined is wrong (low oil, engine hot). On the other hand, observability goes a step further, providing a comprehensive diagnostics toolkit, enabling the identification of root causes such as a sensor failure affecting fuel mix, and insights into how different systems interact. Observability gives a deeper look at issues that traditional monitoring cannot provide.
Limitations of traditional runtime observability
Traditional observability and application performance monitoring (APM) tools are great for monitoring runtime performance – identifying latency, errors, and resource usage (the “what” and “when”) – but often fall short in explaining the deeper “why” rooted in application architecture. They don’t have visibility into the structural design, complex dependencies, and accumulated architectural technical debt that causes recurring runtime problems. They highlight the symptoms of poor architecture (slow transactions or cascading failures) rather than the underlying structural issues. This means you can’t leverage these insights to fix root causes or proactively plan for modernization.
Emerging areas in observability: beyond runtime telemetry data
To fill the gaps left by runtime-focused tools, several purpose-built observability areas are emerging that complement standard observability tools offering deeper insights into specific domains:
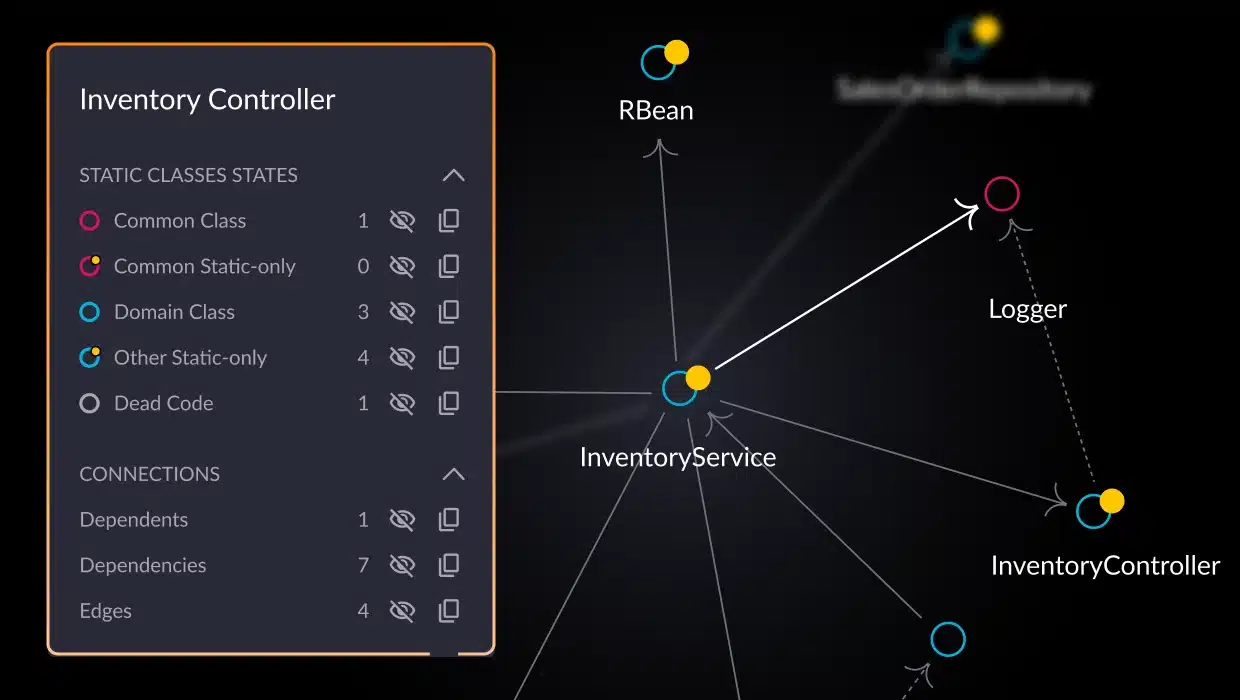
- Architectural observability: Focuses on understanding the application’s static and dynamic structure, component dependencies, architectural drift, and technical debt. Tools like vFunction analyze how the application is built and identify structural issues in the business logic, guiding modernization or refactoring efforts and supporting software architecture governance.
- Data observability: Concentrates on the health and reliability of data pipelines and data assets. Monitors data quality, freshness, schema changes, and lineage so you can trust the data used for analytics and operations.
- API observability: Provides deep visibility into the performance, usage, and compliance of APIs, which are the communication points in modern distributed systems. Helps track API behavior, identify errors, and understand consumer interactions. Some platforms, such as Moesif, can also use the observability data for monetization and API governance.
These emerging areas complement runtime observability and give you a more complete picture of complex software systems.
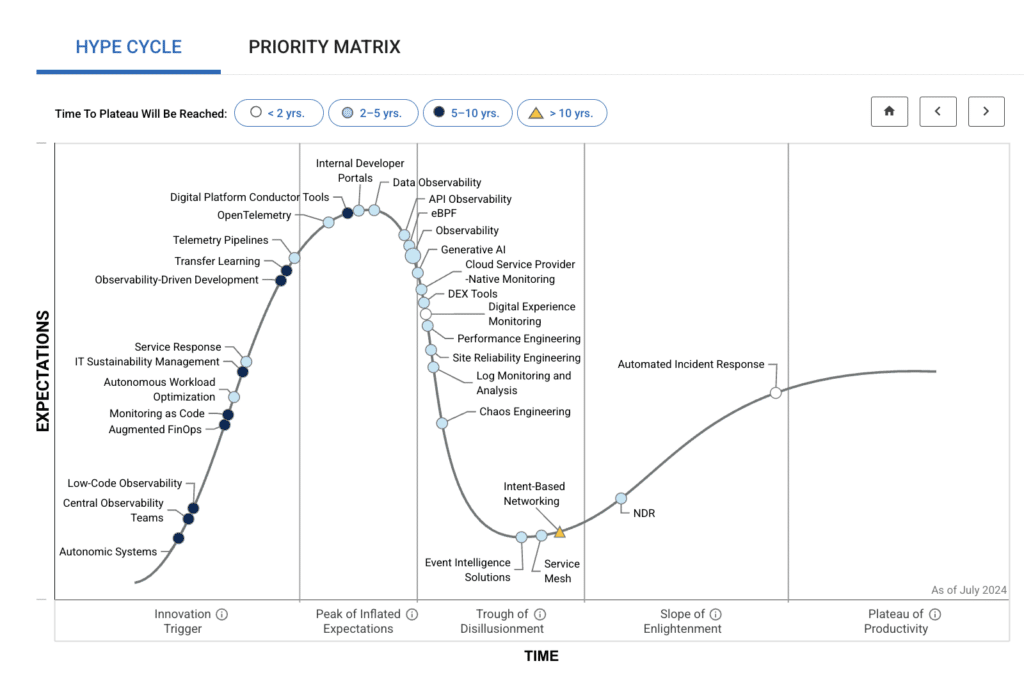
Gartner® Hype cycle for monitoring and observability 2024 showcases a range of technologies along the observability spectrum.
The strategic role of OpenTelemetry
Underpinning much of the progress in both traditional and emerging observability areas is OpenTelemetry (OTel). Its rapid adoption across the industry is a big shift towards standardized, vendor-neutral instrumentation. OTel provides a common language and set of tools (APIs, SDKs, Collector) to generate and collect logs, metrics, and traces across diverse technology stacks. By decoupling instrumentation from specific backend tools, OTel prevents vendor lock-in, ensures that observability can be future-ready, and captures rich telemetry data needed to power all forms of observability. OTel helps power almost all types of observability from runtime APM to architectural, data, and API analysis.
Why observability matters in modern software
With traditional monitoring being around for so long, why is observability so important in modern software? As software systems evolve into complex webs of microservices, APIs, cloud infrastructure, and third-party integrations, simply knowing if something is “up” or “down” is no longer sufficient. The dynamic, distributed nature of modern applications demands deeper insights. Observability has shifted from a ‘nice-to-have’ to a necessity for building, running, and innovating in 2025 and beyond.
Here’s why observability is so important for modern development teams and stakeholders:
Taming complexity and speeding up incident resolution
Modern systems can fail in countless ways. When something goes wrong, pinpointing the root cause across dozens or hundreds of services is impossible with traditional monitoring. Observability gives you the correlated telemetry (traces, logs, metrics) to follow the path of a failing request, understand component interactions, and find the source of the problem, reducing Mean Time To Detection (MTTD) and Mean Time To Resolution (MTTR). It lets you debug the “unknown unknowns”, a.k.a. the things you couldn’t have anticipated.
Building more reliable and resilient systems
By giving you a deep understanding of how systems behave under different loads and conditions, observability helps you identify potential bottlenecks, cascading failure risks, and performance degradation before they cause user-facing outages. This allows you to target improvements and architectural changes that make the system more stable and resilient in a data-driven manner.
Boosting developer productivity and enabling faster innovation
When developers can see the impact of their code changes in production-like environments, this visibility accelerates the whole development lifecycle. Integrating observability into your workflow early (known as “shifting left”) lets engineers debug more efficiently, gain confidence in their releases, and understand performance implications of code changes. The end result is faster and safer deployments within DevOps and SRE frameworks.
Better end-user experience
It’s no surprise that system performance impacts user satisfaction. Slow load times, intermittent errors, or feature failures can drive users away. Observability lets you identify and troubleshoot issues affecting specific user cohorts or transactions, even subtle ones that won’t trigger standard alerts, for a better, more consistent customer experience.
Optimizing performance and cost
Cloud environments offer scalability and potential cost savings. However, on the flip side, they can also lead to runaway costs if not managed. Observability helps you identify inefficient resource usage, redundant service calls, or performance bottlenecks that waste compute power and inflate cloud bills. Knowing where time and resources are spent by leveraging observability tools allows you to target optimization efforts, improve efficiency, and reduce operational expenses.
Enhanced security posture
There is an increasing overlap between operational monitoring and security, with observability as a major factor in these blurring lines. Observing system behavior, network traffic, and API interactions can reveal anomalies that indicate security threats, such as unusual access patterns, data exfiltration attempts, or compromised services. This allows observability data to provide context for security investigations and detection of exploits. The best defense in terms of security is always being proactive; however, when vulnerabilities do slip through, the early detection that observability can provide is critical.
Overall, observability is part of the fabric of modern applications. Beyond simply writing and publishing code, applications are expected to be scalable, secure, and performant. Observability is a major part of ensuring that applications are able to hit these expectations.
How to choose the right software observability tool
Knowing the necessity of observability leads to the crucial step of selecting the right tools. Decide by evaluating key features and capabilities offered by each platform. Focus on:
Data coverage and integration
When selecting an observability tool, ensure that the tool supports the essential data types (logs, metrics, traces) needed for your specific application and use case. Assess the tool’s ability to efficiently ingest, store, and correlate data. Understand costs and data storage impact, if relevant. Check the tool’s compatibility with key technologies in your stack, including:
- Cloud providers such as AWS, Azure, and GCP
- Container platforms like Kubernetes
- Programming languages and frameworks: Java, Python, Go, Node.js, .NET
- Databases, message queues, and serverless infrastructure
Additionally, look for support for OpenTelemetry (OTel), which offers vendor-neutral instrumentation, ensuring there are no lock-ins and allowing for future flexibility.
Correlation and contextualization
Isolated data points don’t offer much value on their own; it’s the connected insights that truly matter. The standout feature for observability tools is their capability to automatically link related logs, metrics, and traces from a single user request, transaction, or system event. Attempting to manually combine this data across various systems is not only slow but is also likely to lead to mistakes. Moreover, consider how well the tool can enrich telemetry data with additional context and automate subsequent actions. Can the tool associate performance data with specific actions like code deployments, changes in feature flags, infrastructure updates, or details of user sessions? This extra layer of context is vital for effective problem-solving and debugging.
Analysis, querying, and visualization
The freedom to explore your data is essential for effective observability. Evaluate the platform’s query capabilities—are they powerful and flexible enough to handle complex, ad-hoc queries, especially for high cardinality data? Also, the depth of visualization features should be considered. Do the dashboards provide intuitive, customizable, and effective tools for displaying complex system interactions? Key visualization features to look for include service maps showing dependencies, distributed trace views like flame graphs, and clear metric charting.
It’s also crucial to ensure the platform supports analysis and querying at your required scale, as telemetry data from modern applications often demands substantial storage and processing resources.
Beyond manual exploration, many platforms now incorporate AI and machine learning (AI/ML) features for tasks such as automated anomaly detection, noise filtering to reduce alert fatigue, root cause analysis, and even predictive insights. While AI features are becoming standard, it’s important to assess their maturity and usefulness in practice.
Ease of use and learning curve
A tool is only as effective as its usability. The platform should offer an intuitive interface tailored to the needs of developers, engineers, SREs, and operations teams. Evaluate the effort required to set up the tool, including application instrumentation (automatic vs. manual), alert configuration, and ongoing support and maintenance. Strong documentation, responsive vendor support, and a user community are equally critical—they can significantly impact both the ease of adoption and the long-term success of the tool within your organization.
Cost and pricing model
Observability can quickly become a big operational expense. Make sure you fully understand the pricing model and available options. Is the pricing model based on data volume (ingested or stored), number of hosts or nodes monitored, active users, specific features, a combination of these, or other pricing variables for emerging solutions? Ensure that the pricing model is transparent and predictable so that you can forecast the costs as you scale. Before committing, calculate the Total Cost of Ownership (TCO) including data egress fees and storage costs as your applications scale. Also be aware of any professional services or training that your team will need in order to deploy and use the tool. Your best bet is to look for vendors with flexible models that match your usage patterns and expected scale.
Specific needs and future goals
Ultimately, ensure the tool’s capabilities align with your specific goals. Are you primarily focused on APM, or do you also require features like in-depth infrastructure monitoring, log aggregation and analysis, or security event correlation? Critically, do your goals go beyond runtime monitoring? Do you need to understand the underlying application architecture, identify technical debt hotspots or gain visibility for modernization initiatives? Some tools are great at performance monitoring while others are more specialized such as vFunction, focused on deeper architectural observability and analysis.
Start by prioritizing your key requirements, then shortlist 2-3 tools for Proof of Concept (POC) testing using realistic workloads. Involve the daily users—developers, SREs, or operations teams—to gather actionable feedback. Use POC results to make an informed decision on the best tool for your needs.
Core capabilities of modern observability tools
Modern observability tools are engineered to deliver comprehensive insights into the performance, health, and behavior of today’s complex systems. As organizations increasingly rely on distributed architectures, microservices, and cloud infrastructure, the need for robust observability platforms has never been greater. These tools go beyond basic monitoring by offering a suite of core capabilities that empower teams to proactively manage, troubleshoot, and optimize their environments.
Key capabilities of modern observability tools include infrastructure monitoring, distributed tracing, log management, and metrics collection. Together, these features enable organizations to gain a holistic view of their systems, quickly identify issues, and make informed decisions to enhance reliability and performance. By leveraging these capabilities, teams can transform raw observability data into actionable insights, ensuring their systems remain resilient and efficient even as complexity grows.
Infrastructure monitoring
Infrastructure monitoring is foundational to any observability strategy. Modern observability tools continuously collect and analyze data from critical infrastructure components such as servers, virtual machines, containers, networks, and databases. By monitoring metrics like CPU utilization, memory consumption, disk I/O, and network throughput, these tools provide real-time visibility into the health and performance of the underlying infrastructure.
In addition to metrics, observability tools gather logs and traces from infrastructure components, enabling teams to detect anomalies, forecast capacity needs, and respond to incidents before they escalate. Effective infrastructure monitoring helps organizations optimize resource allocation, minimize downtime, and maintain high availability across their environments. By making infrastructure data accessible and actionable, monitoring tools empower teams to keep their systems running smoothly and efficiently.
Distributed tracing
Distributed tracing is a critical capability for understanding the flow of requests across complex, distributed systems. Observability tools equipped with distributed tracing can track individual transactions as they traverse multiple services, APIs, and infrastructure layers. By collecting detailed logs and traces at each step, these tools reveal how requests are processed, where delays occur, and how different components interact.
This end-to-end visibility is essential for diagnosing performance bottlenecks, identifying sources of latency, and ensuring optimal system performance. Distributed tracing enables teams to pinpoint issues that would be difficult or impossible to detect with traditional monitoring, making it an indispensable tool for maintaining the health of modern, interconnected applications.
Log management
Log management solutions are another cornerstone of modern observability. Observability tools collect, store, and analyze log data from a wide range of sources, including applications, infrastructure, and security systems. By centralizing log data, these tools provide a unified view of system behavior, making it easier to detect anomalies, investigate incidents, and track changes over time.
Advanced log management capabilities allow teams to search, filter, and correlate log entries, uncovering patterns and root causes that might otherwise go unnoticed. In addition to supporting operational troubleshooting, robust log management helps organizations meet compliance requirements by maintaining a secure, auditable record of system activity.
Metrics collection tools
Metrics collection tools play a vital role in observability by gathering quantitative data on system performance, usage, and health. These tools collect telemetry data from applications, infrastructure, and services, tracking key performance indicators such as response times, error rates, throughput, and resource utilization.
By visualizing and analyzing metrics, organizations gain comprehensive insights into system behavior and can quickly identify trends or deviations from expected performance. Metrics collection tools enable proactive optimization, helping teams reduce downtime, improve reliability, and deliver a better user experience. With the ability to collect telemetry data from diverse sources, observability platforms provide a single source of truth for monitoring and managing complex environments.
Together, these core capabilities ensure that observability tools provide the comprehensive insights needed to monitor, analyze, and optimize modern systems. By unifying data from logs, metrics, and traces, observability platforms empower organizations to make data-driven decisions, enhance system reliability, and deliver exceptional user experiences.
Top 10 software observability tools (2025)
Selecting the right software observability tool is complex, with each tool offering unique strengths in data gathering, analysis, and application. Here, we spotlight the top ten tools and frameworks of 2025, showcasing both established solutions and innovative newcomers that tackle the critical issues faced in contemporary software development and operations. Let’s take a look:

vFunction
We’ll kick off our list of observability tools with vFunction, an emerging solution founded in 2017. Purpose-built to manage complexity and technical debt in modern software systems, it also complements traditional APM tools by providing deep architectural insight. As business logic becomes more distributed—and harder to trace—vFunction helps teams improve system understanding to regain architectural control, reduce risk, and accelerate decision-making. Using architectural observability, vFunction continuously visualizes application architecture, detects issues like redundancies and circular dependencies, and automates the identification and resolution of complex service interactions across both monoliths and microservices.
Key observability features:
- vFunction provides real-time architectural insight across both monoliths and distributed services—using patented static and dynamic analysis to uncover hidden dependencies, dead code, and complex flows in Java and .NET monoliths, and leveraging runtime observation with OpenTelemetry to automatically visualize service interactions in distributed environments (supporting Node.js, Python, Go, and more).
- Intelligent analysis is applied across the application architecture to address surface architectural concerns such as service redundancies, circular dependencies, tight coupling, overly complex flows, performance anomalies, and API policy violations, enabling teams to act before issues escalate.
- Correlation of OpenTelemetry traces with AI-driven architectural analysis to uncover structural bottlenecks contributing to performance issues, going beyond traditional APM trace visualization.
- Architectural insights from the vFunction analysis produce a list of ‘To Do’ development tasks that automatically feed Generative AI code assistants like Co-pilot and Amazon Q, which generate the actual code fixes for the architectural issues identified by vFunction.
vFunction’s observability features are best suited for engineering teams needing visibility and control over complex distributed applications or those modernizing monolithic systems. It helps teams who want to go beyond surface-level service maps to understand the why behind architectural complexity, identify hidden dependencies impacting performance and resilience, and proactively manage architectural drift and technical debt.
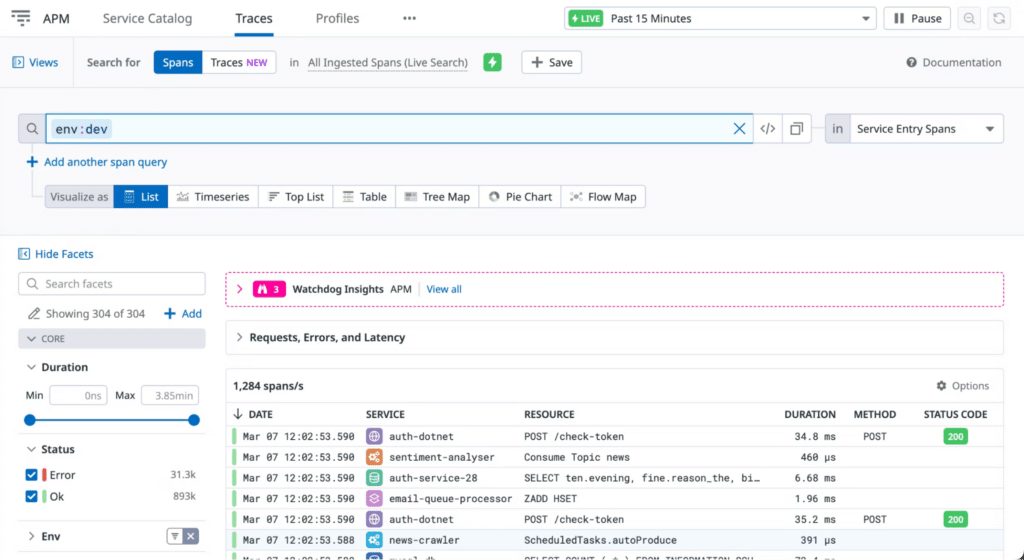
Image courtesy of Datadog
Datadog
Datadog, founded in 2010, is a leading SaaS observability platform designed for cloud-scale applications and infrastructure. It is known for providing a unified view across diverse monitoring domains, consolidating data from hundreds of integrations into a single interface. Datadog helps teams monitor infrastructure, applications, logs, security, and user experience in complex, dynamic environments.
Key observability features:
- A unified observability platform integrates infrastructure, APM, logs, real user monitoring (RUM), synthetics, security, and network monitoring.
- Extensive library of pre-built integrations for cloud providers, services, and technologies.
- Real-time dashboards, alerting, and collaboration features enable teams to track key metrics like request latency, CPU utilization, and error rates.
Datadog’s observability features are best suited for DevOps teams, SREs, and developers who need comprehensive, end-to-end visibility across their entire cloud or hybrid stack within a single platform. Datadog excels at correlating data from different sources to provide context during troubleshooting.
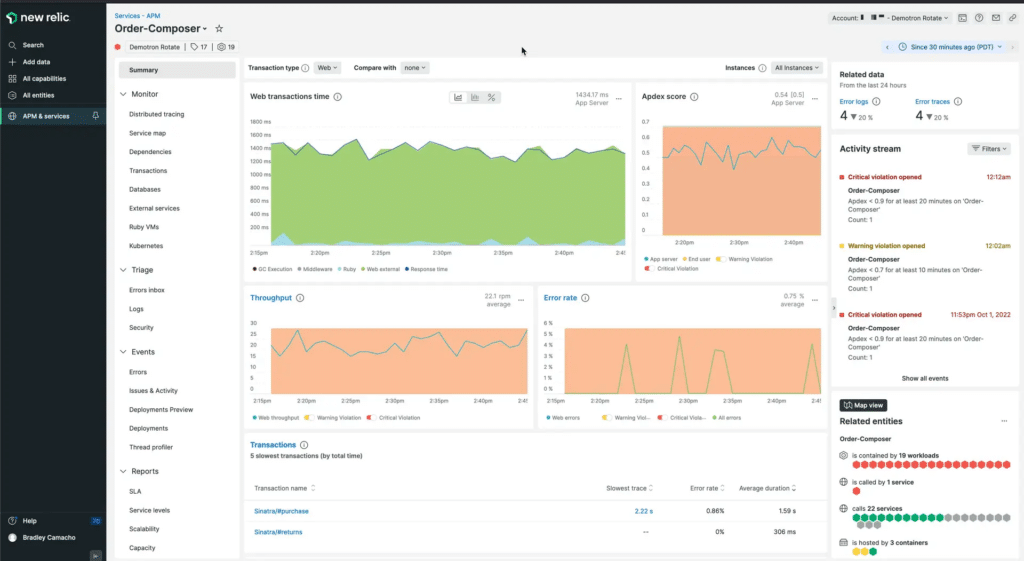
Image courtesy of New Relic
New Relic
New Relic, established in 2008, pioneered the APM market as a SaaS solution. New Relic is known for its deep insights into application performance and has expanded into a full-stack observability platform. New Relic helps engineering teams understand application behavior, troubleshoot issues, and optimize performance throughout the software lifecycle.
Key observability features:
- Deep code-level APM diagnostics and distributed tracing.
- Full-stack monitoring including infrastructure, logs, network, and serverless functions.
- Digital experience monitoring (Real User Monitoring (RUM), and Synthetics).
New Relic’s observability features are best suited for teams prioritizing application performance management, reliability, and understanding the root cause of issues within the application code itself. It provides developers and SREs with the detailed data needed to optimize complex applications.
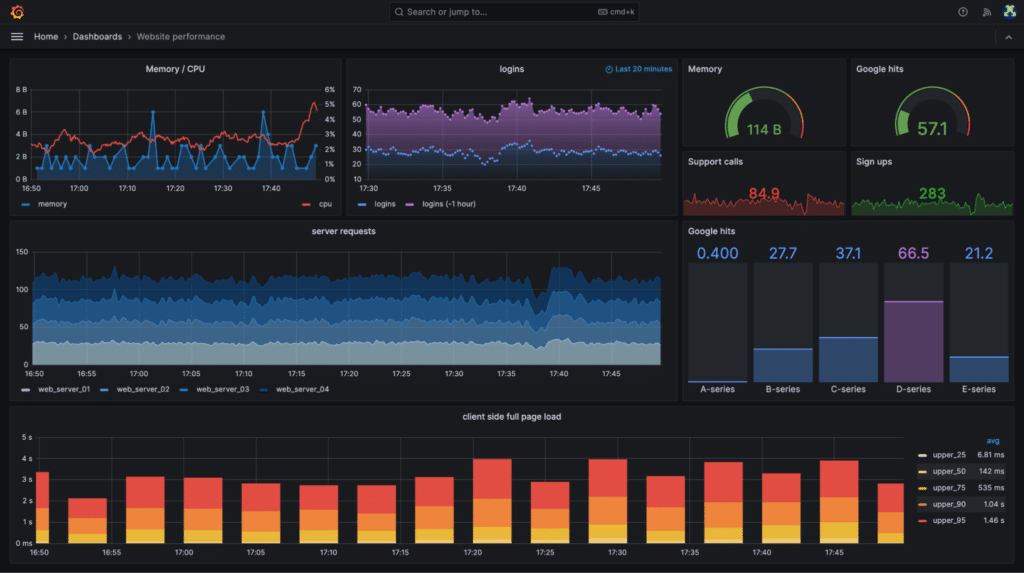
Image courtesy of Grafana
Grafana & Prometheus
Prometheus (started 2012) is a Cloud Native Computing Foundation (CNCF) open-source project focused on time-series metric collection and alerting, while Grafana is the leading open-source platform for visualization and analytics, often used together. They are known as a de facto standard for metrics monitoring and dashboarding, especially in Kubernetes and cloud-native ecosystems.
Key observability features:
- Prometheus: Efficient time-series database, powerful PromQL query language, service discovery, and alerting via Alertmanager.
- Grafana: Highly customizable dashboards, support for numerous data sources (including Prometheus, Loki, Tempo), extensive plugin ecosystem.
- Often combined with Loki for logs and Tempo for traces to build a full open-source observability stack (PLG/LGTM stack).
Grafana & Prometheus observability features are best suited for teams seeking powerful, flexible, and often self-managed open-source solutions for monitoring and data visualization. They excel in metrics-driven monitoring and alerting, providing deep customization for technical teams managing cloud-native environments.
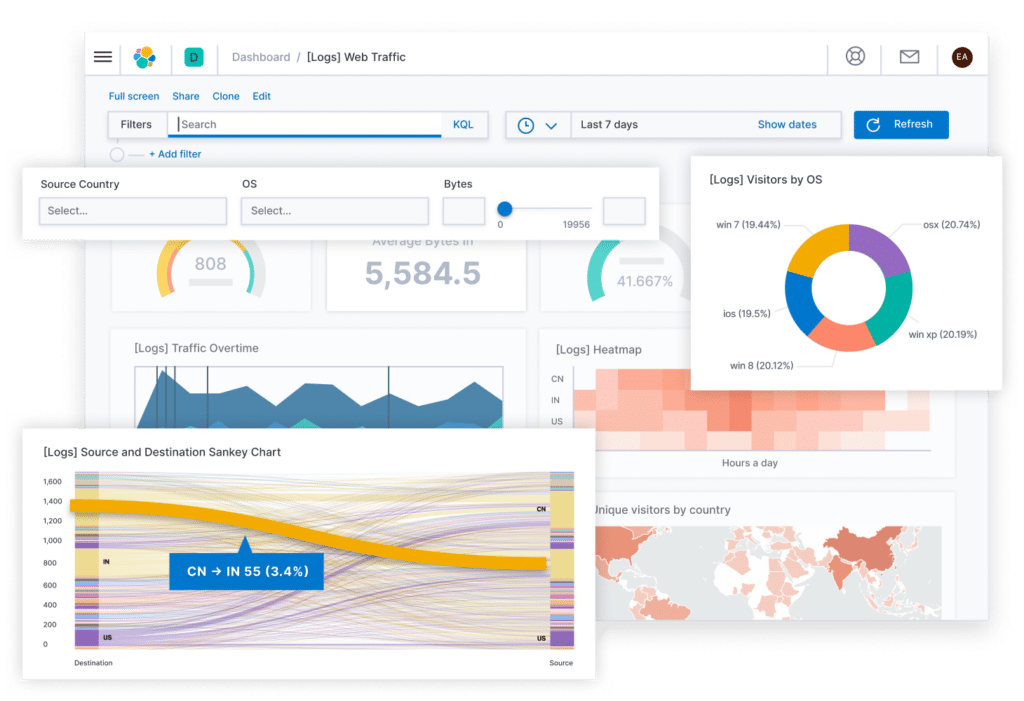
Image courtesy of Elastic
Elastic Observability (ELK Stack)
Elastic Observability evolved from the widely adopted ELK Stack (Elasticsearch, Logstash, Kibana), initially known for its powerful open-source log aggregation and search capabilities. Elastic Observability now integrates metrics, APM, and security analytics (SIEM) into a unified platform, available both as a self-managed infrastructure and via Elastic Cloud.
Key observability features:
- Robust log aggregation, storage, search, and analysis powered by Elasticsearch.
- Integrated APM with distributed tracing and service maps.
- Infrastructure and metrics monitoring using Elastic Agent (integrating capabilities previously in Beats).
Elastic Observability’s features are best suited for teams requiring strong log analytics as a core capability, often starting with logging use cases and expanding into APM and infrastructure monitoring. Elastic Observability is valuable for operations, security, and development teams needing integrated insights across logs, metrics, and traces.
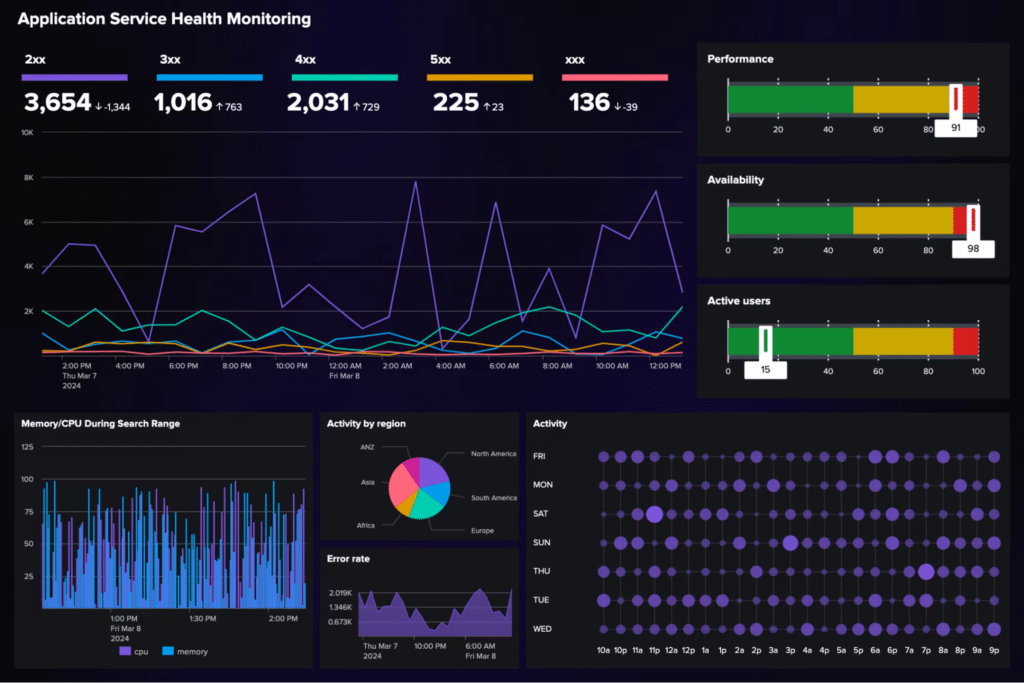
Image courtesy of Splunk
Splunk
Splunk, founded in 2003, is a market leader in analyzing machine-generated data, renowned for its powerful log management and SIEM capabilities. It has extended its platform into the Splunk Observability Cloud, integrating APM and infrastructure monitoring with its core data analysis strengths.
Key observability features:
- Industry-leading log data indexing, searching using Splunk Search Processing Language (SPL), and analysis capabilities.
- Full-fidelity APM with NoSample tracing.
- Real-time infrastructure monitoring, RUM, and synthetic monitoring.
Splunk’s observability features are best suited for organizations, often large enterprises, that need powerful data investigation capabilities across IT operations and security. Teams benefit from its ability to correlate observability data (metrics, traces, logs) with deep log insights and security events.
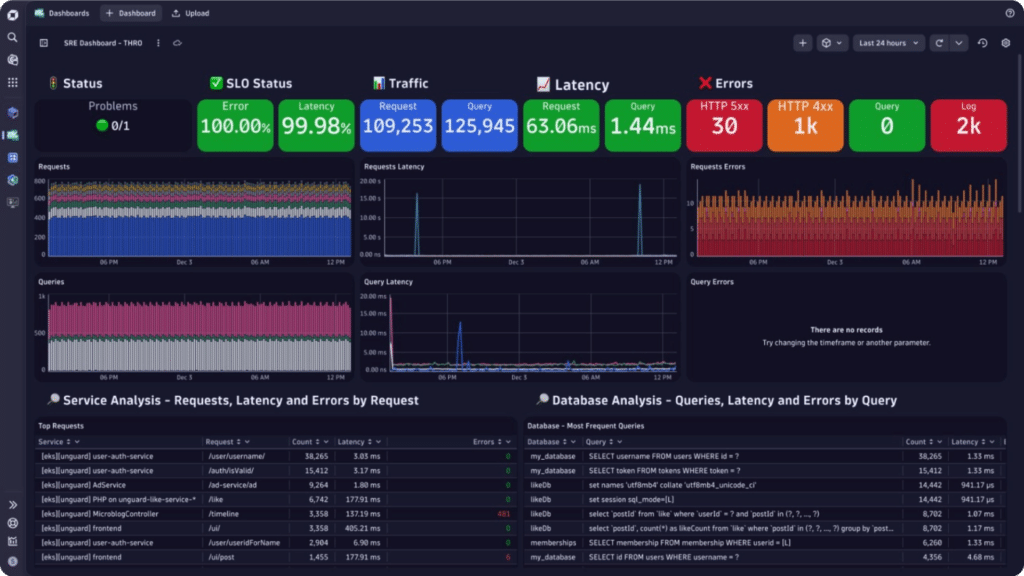
Image courtesy of Dynatrace
Dynatrace
Dynatrace, with origins in 2005, provides a highly automated, AI-powered observability and security platform. It is known for its OneAgent technology for automatic full-stack instrumentation and its Davis AI engine for automated root cause analysis and anomaly detection across complex enterprise environments.
Key observability features:
- Automated discovery, instrumentation, and topology mapping via OneAgent.
- AI-driven analysis (Davis) for automatic root cause detection, anomaly detection, and predictive insights.
- Full-stack visibility including infrastructure components, applications, logs, user experience (RUM/Synthetics), and application security.
Dynatrace’s observability features are best suited for medium-to-large enterprises seeking a high degree of automation and AI-driven insights to manage complex hybrid or multi-cloud environments. It reduces manual effort in configuration and troubleshooting for IT Ops, SRE, and DevOps teams.
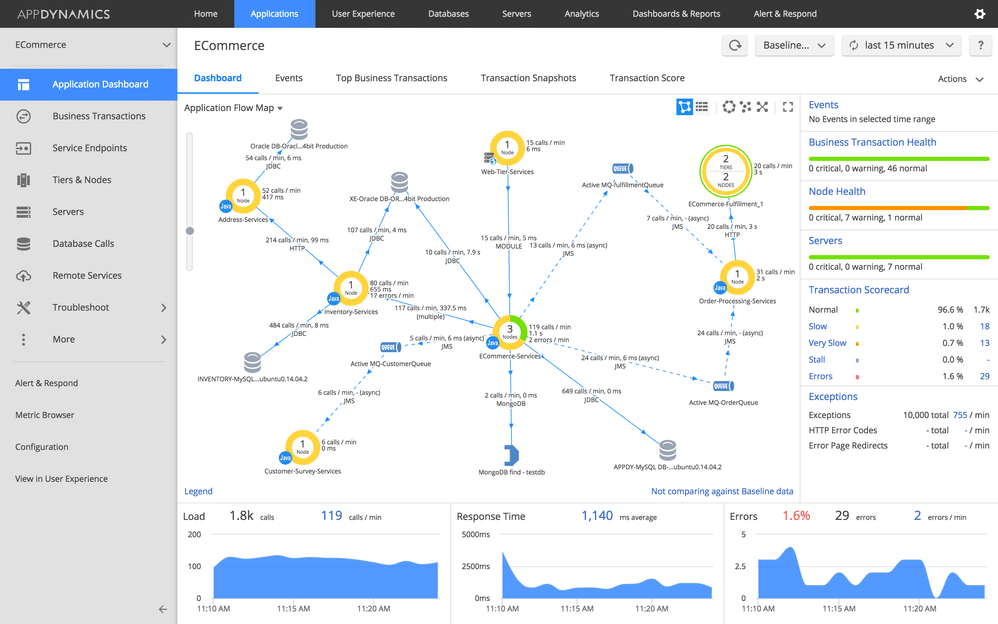
App Dynamics image courtesy of Splunk community
AppDynamics
AppDynamics, founded in 2008 and now part of Cisco, is a leading APM platform, particularly known for its ability to connect application performance to business outcomes. It helps organizations monitor critical applications and understand the business impact of performance issues.
Key observability features:
- Deep APM with code-level visibility.
- Business transaction monitoring, mapping user journeys, and critical workflows.
- Correlation of IT performance metrics with business KPIs (Business IQ).
AppDynamics’ observability features are best suited for enterprises where understanding the direct link between application performance and key business metrics (like revenue or conversion rates) is crucial. It’s ideal for application owners, IT and business analysts focused on business-critical systems.
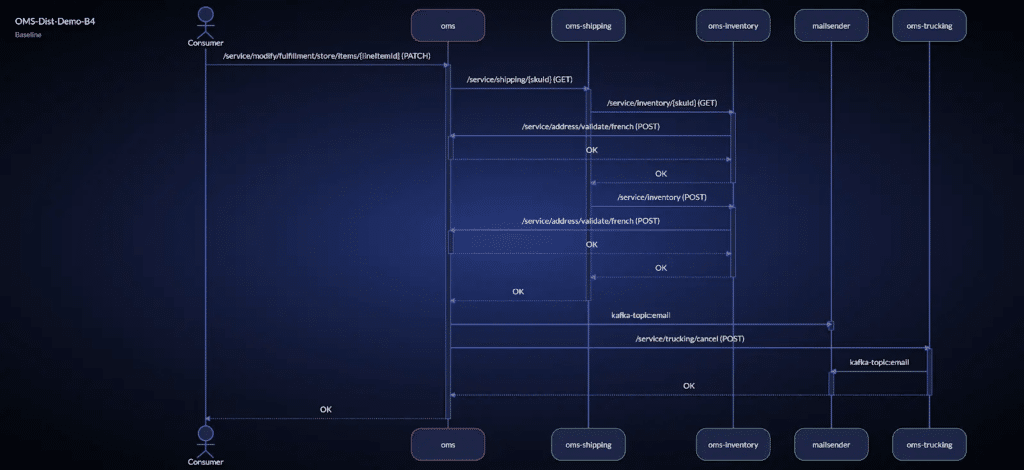
vFunction using OpenTelemetry tracing data to inform real-time sequence flows of applications
OpenTelemetry
OpenTelemetry (OTel) is not a vendor platform but an open-source observability framework stewarded by the CNCF, created from the merger of OpenTracing and OpenCensus around 2019. It is known for standardizing the way applications and infrastructure are instrumented to produce telemetry data (logs, metrics, traces).
Key observability features:
- Vendor-neutral APIs and SDKs for code instrumentation across multiple languages.
- OpenTelemetry Collector for receiving, processing, and exporting telemetry data to various backends.
- Standardized semantic conventions for telemetry data, ensuring consistency.
OpenTelemetry is best suited for any organization building or operating modern software that wants to avoid vendor lock-in for instrumentation. It empowers developers and platform teams to instrument once and send data to their choice of observability backends, ensuring portability and flexibility.
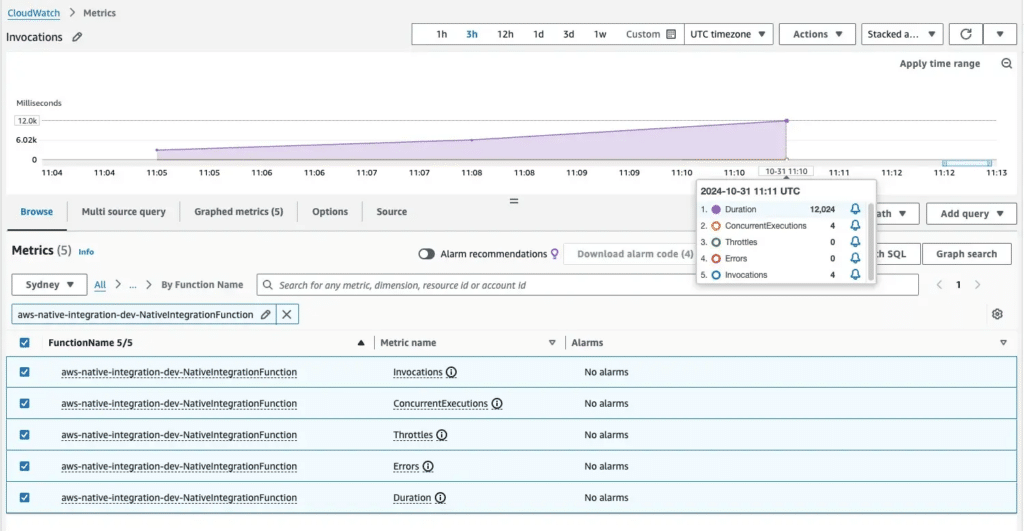
Image courtesy of AWS fundamentals
AWS CloudWatch
AWS CloudWatch is the native monitoring and observability service integrated within Amazon Web Services, evolving significantly since its initial launch in 2009. It is known for providing seamless monitoring for resources and applications running on the AWS platform.
Key observability features:
- Automatic data collection of metrics and logs from dozens of AWS services.
- Customizable dashboards and alarms based on metrics or log patterns.
- Integration with AWS X-Ray for distributed tracing within the AWS ecosystem.
AWS CloudWatch’s observability features are best suited for teams whose operations are primarily in the AWS cloud. It offers convenient, built-in monitoring for AWS services, making it ideal for administrators and developers managing AWS infrastructure and applications.
Conclusion
As we advance into 2025, software becomes even more complex, especially with the widespread use of microservices and cloud-native approaches. Now, having a clear, full view of your systems is crucial. But achieving this insight goes beyond simple monitoring—it’s about observability.
Observability allows us to see not just what’s happening in our systems but also why issues like slow performance or errors arise. It sheds light on the hidden issues like bottlenecks and technical debt that can compromise system efficiency and growth. Combining insights from both the operational side and the architectural perspective helps teams identify and tackle root causes rather than just patching up symptoms.vFunction empowers teams to go beyond runtime monitoring by providing deep architectural insights. With patented tools that identify hidden dependencies, structural bottlenecks, and technical debt, vFunction enables you to fix root causes, not just symptoms. Simplify modernization, boost resilience, and scale with confidence. Ready to take your observability to the next level? Discover vFunction today!