


This post was originally featured on TheNewStack, sponsored by vFunction.
If you’re a software developer, then “technical debt” is probably a term you’re familiar with. Technical debt, in plain words, is an accumulation over time of lots of little compromises that hamper your coding efforts. Sometimes, you (or your manager) choose to handle these challenges “next time” because of the urgency of the current release.
This is a cycle that continues for many organizations until a true breaking point or crisis occurs. If software teams decide to confront technical debt head on, these brave software engineers may discover that the situation has become so complex that they do not know where to start.
The difficult part is that decisions we make regarding technical debt have to balance between short-term and long-term implications of accumulating such debt, emphasizing the need to properly assess and address it when planning development cycles.
The real-world implications of this is seen in a recent survey of 250 senior IT professionals, in which 97% predicted organization pushback to app modernization projects, with the primary concern of both executives and architects being “risk.” For architects, we can think of this as “technical risk” — the threat that making changes to part of an application will have unpredictable and unwelcome downstream effects elsewhere.
The Science Behind Measuring Technical Debt
In their seminal article from 2012, “In Search of a Metric for Managing Architectural Technical Debt”, authors Robert L. Nord, Ipek Ozkaya, Philippe Kruchten and Marco Gonzalez-Rojas offer a metric to measure technical debt based on dependencies between architectural elements. They use this method to show how an organization should plan development cycles while taking into account the effect that accumulating technical debt will have on the overall resources required for each subsequent version released.
Though this article was published nearly 10 years ago, its relevance today is hard to overstate. Earlier this March, it was received the “Most Influential Paper” award at the 19th IEEE International Conference on Software Architecture.
In this post, we will demonstrate that not only is technical debt key to making decisions regarding any specific application, it is also important when attempting to prioritize work between multiple applications — specifically, modernization work.
Moreover, we will show a method that can be used to not only compare the performance of different design paths for a single application, but also compare the technical debt levels of multiple applications at an arbitrary point in their development life cycle.
Accurately Measuring Systemwide Technical Debt
In the IEEE article mentioned above, calculating technical debt is done using a formula that mainly relies on the dependencies between architectural elements in the given application. It is worth noting that the article does not define what constitutes an architectural element or how to identify these elements when approaching an application.
We took a similar approach and devised a method to measure technical debt of an application based on the dependency graph between its classes. The dependency graph is a directional graph G=V, E, in which the V=c1, c2, … is the set of all classes in the application and an edge e=⟨c1, c2⟩E exists between two vertices if class c1 depends on class c2 in the original code. We perform multifaceted analysis on the graph to eventually come up with a score that describes the technical debt of the application. Here are some of the metrics we extract from the raw graph:
- Average/median outdegree of the vertices on the graph.
- Top N outdegree of any node in the graph.
- Longest paths between classes.
Using standard clustering algorithms on the graph, we can identify communities of classes within the graph and measure additional metrics on them, such as:
- Average outdegree of the identified communities.
- Longest paths between communities.
The hypothesis here is that by using these generic metrics on the dependency graphs, we can identify architectural issues that represent real technical debt in the original code base. Moreover, by analyzing dependencies on these two levels — class and community — we give a broad interpretation of what an architectural element is in practice without attempting to formally define it.
To test this method, we created a data set of over 50 applications from a variety of domains — financial services, eCommerce, automotive and others — and extracted the aforementioned metrics from them. We used this data set in two ways.
First, we correlated specific instances of high-ranking occurrences of outdegrees and long paths with local issues in the code. For example, identifying god classes by their high outdegree. This proved efficient and increased our confidence level that this approach is valid in identifying local technical debt issues.
Second, we attempted to provide a high-level score that can be used not only to identify technical debt in a single application, but also to compare technical debt between applications and to use it to help prioritize which should be addressed and how. To do that, we introduced three indexes:
- Complexity — represents the effort required to add new features to the software.
- Risk — represents the potential risk that adding new features has on the stability of existing ones.
- Overall Debt — represents the overall amount of extra work required when attempting to add new features.
From Graph Theory to Actionable Insights
We manually analyzed the applications in our data set, employing the expert knowledge of the individual architects and developers in charge of product development, and scored each application’s complexity, risk and overall debt on a scale of 1 to 5, where a score of 1 represents little effort required and 5 represents high effort. We used these benchmarks to train a machine learning model that correlates the values of the extracted metrics with the indexes and normalizes them to a score of 0 to 100.
This allows us to use this ML model to issue a score per index for any new application we encounter, enabling us to analyze entire portfolios of applications and compare them to each another and to our precalculated benchmarks. The following graph depicts a sample of 21 applications demonstrating the relationship between the aforementioned metrics:
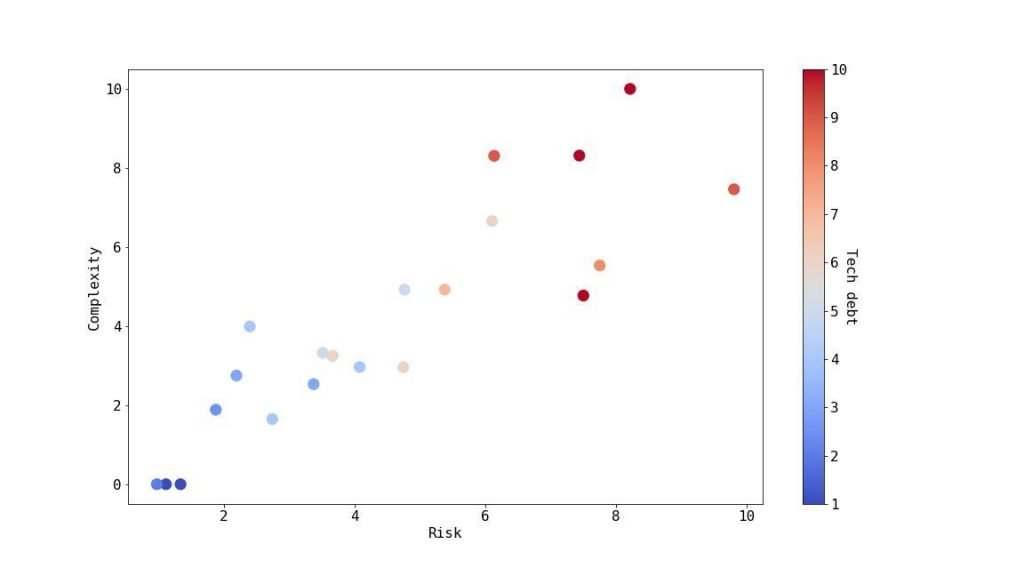
The overall debt levels were then converted into currency units, depicting the level of investment required to add new functionality into the system. For example, for each $1 invested in application development and innovation, how much goes specifically to maintaining architectural technical debt? This is intended to help organizations build a business case for handling and removing architectural technical debt from their applications.
We have shown a method to measure the technical debt of applications based on the dependencies between its classes. We have successfully used this method to both identify local issues that cause technical debt as well as to provide a global score that can be compared between applications. By employing this method, organizations can successfully assess the technical debt in their software, which can lead to improved decision-making around it.