How AI is redefining modernization for the world’s largest applications
We’re honored to receive the 2025 CODiE Award for Best Use of AI in Software Development. This recognition affirms our belief in AI’s power to transform how engineers modernize and scale enterprise applications, and it’s a proud milestone for our team.
The CODiEs are the industry’s longest-running, peer-reviewed awards program celebrating innovation and excellence in business and technology. Each entry undergoes a rigorous, hands-on evaluation by expert judges and industry peers, who assess every product for its innovation, impact, and value, making this recognition especially meaningful.
“The CODiE Awards celebrate the visionaries shaping the future of technology,” said Jennifer Baranowski, President of the CODiE Awards. “This year’s winners exemplify how innovation, leadership, and purpose can come together to create solutions that move industries forward and make a lasting impact.”
About our technology
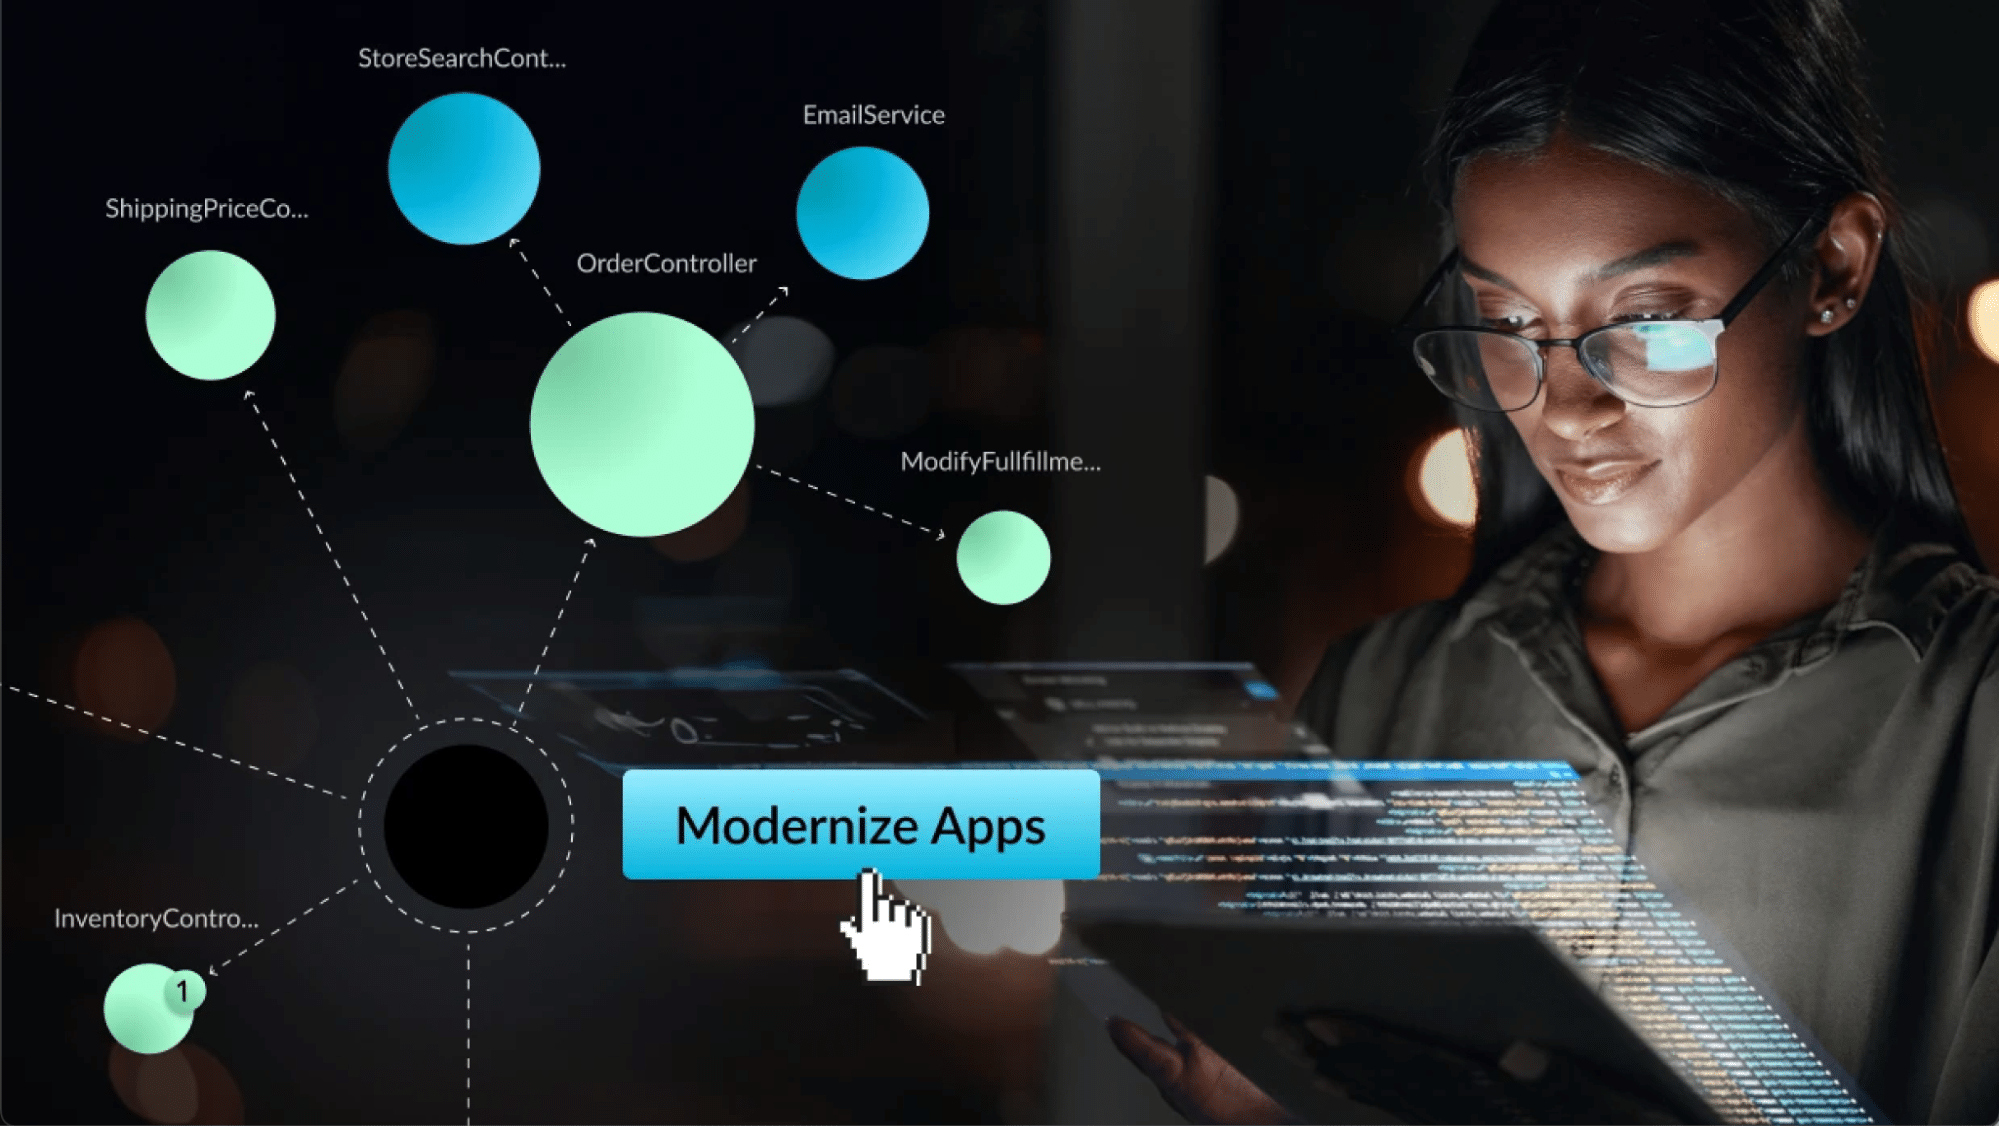
vFunction addresses one of software’s toughest challenges: the architectural complexity that slows innovation and limits agility in the cloud. We help enterprises modernize applications to fully leverage advanced cloud services, including serverless technologies. Enterprise apps—often with tens of millions of lines of code—are monolithic, tightly coupled, and difficult to evolve. This complexity stalls innovation and elevates risk especially when moving to the cloud.
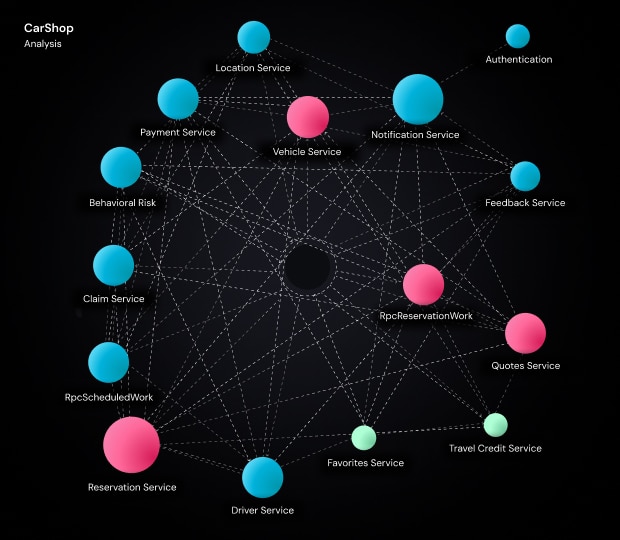
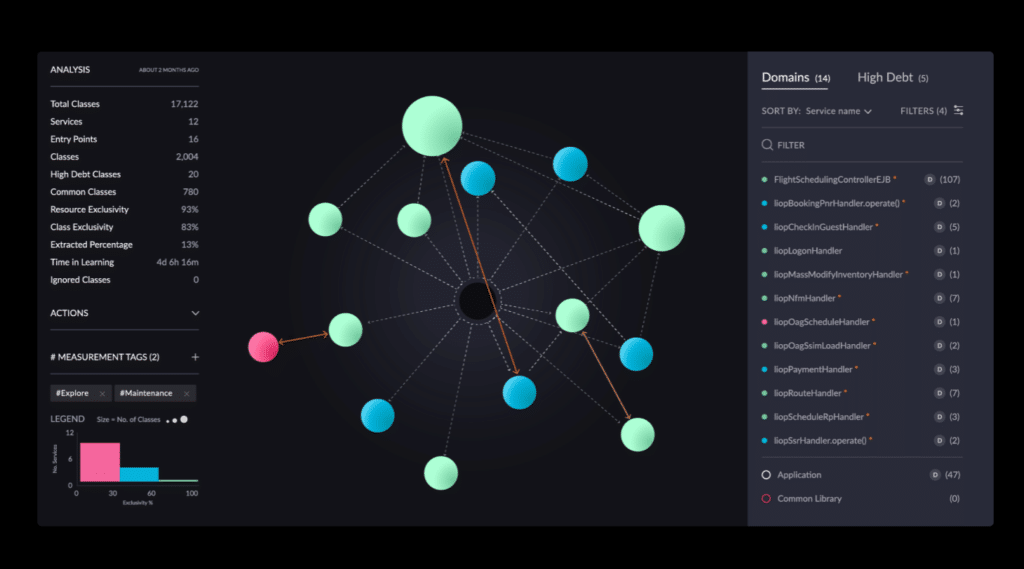
vFunction’s visualization of a complex enterprise app sets the stage for accelerated refactoring.
As systems grow, every company faces these issues. Addressing monolith complexity is essential to unlocking cloud benefits, such as scalability, cost efficiency, and rapid feature deployment.
Our AI-driven architectural modernization platform helps teams analyze their architecture, visualize it, identify architectural technical debt, and automatically refactor and modernize applications—at least 15× faster than traditional methods.
At vFunction, we tackle one of software’s most persistent challenges: the architectural complexity that limits the speed and agility of mission-critical applications.
Moti Rafalin, CEO and Co-Founder, vFunction
During the judging process, vFunction was evaluated through a live demonstration showcasing how our AI addresses real-world complexity—helping engineers slash what once took months of manual analysis and refactoring. Judges assessed vFunction across the key dimensions that define innovation in software development: AI integration, developer productivity, accuracy and reliability, ease of use, security, and community support.
Case Study
Modernizing the Engine Behind 60% of UK Insurance Quotes
This recognition is more than a milestone—it’s validation of our mission. As applications grow in size and complexity, AI will be essential to modernizing them intelligently and at scale.
We’ll continue pushing the boundaries of how AI and architecture work together to help organizations move faster, reduce risk, and build future-ready systems.
On behalf of the entire vFunction team, I want to thank the CODiE Awards community, the judges, and our customers and partners who continue to inspire us every day. You can view the full list of winners here.
Monolithic architectures are good. I’m the first person to say it. They’re a strong way to start and can withstand high levels of complexity. They perform where microservices of similar intricacy would have long since toppled.
But complexity can cripple innovation and engineering velocity. At vFunction, we believe good architecture is the foundation of good software. We spend time defining good architecture and how to best transform tangled monoliths into microservices or modular monoliths—after first refactoring complexity and reducing internal dependencies in the applications.
What we haven’t discussed in our previous writings and talks are the truly massive monolithic applications we encounter. Think 10-50 million lines of code. Twenty thousand to 100,000 classes. Dependencies so vast you can’t even draw them on a screen.
Welcome to themegalith.
Don’t call it legacy
We often label these very large applications “legacy.” However, they often are the core of the business, representing hundreds of person-years of development. With a serious backlog of innovation and many developers dedicated to them, they contribute significantly to the company’s bottom line.
These megaliths grow out of urgent business needs. Teams work on them under pressure, with little time to spare—prioritizing speed over structure. Engineers accept technical debt due to business urgency. Complexity accumulates to a breaking point.
Megaliths still operate in production, but change is costly. Any update has an impact beyond the code it touches. With no clear boundaries around modules, it’s safer to avoid any risk. Therefore, even though these applications are mission-critical, updates are rare because of the risks involved. So next time you encounter a megalith, please respect it. And don’t call it legacy.
When code assistants can’t handle critical applications
Tools like GitHub Copilot and Amazon Q are impressive. They accelerate code generation and assist with routine programming tasks. They excel at pattern recognition and suggesting completions, leveraging vast datasets of existing code. But they operate at the level of individual code snippets and localized context. The sheer scale and intricate interdependencies of a megalithic application fundamentally challenge these tools.
Code assistants, in their current form, weren’t designed to navigate megalithic levels of systemic complexity.
At megalith scale, you need architecture-aware modernization
Bridging this gap requires a different approach – integrating deep architectural intelligence with AI to analyze, understand, and guide modernization at megalith scale.
This is where dynamic analysis becomes indispensable. While static analysis attempts to map all possible code paths and dependencies from the source code, dynamic analysis observes the application as it runs. It captures real-world execution flows, actual dependency calls, and the true footprint of an application’s behavior. This approach is ideal for megalithic systems. It doesn’t need to comprehend the theoretical entirety of the codebase. Instead, it focuses on how the application operates.
For a megalith with millions of lines of code and thousands of classes, attempting to create a complete static map is an exercise in futility. vFunction runs the application through various use cases observing what’s used and how, so it can:
Identify active dependencies
Delineate architectural boundaries based on runtime interactions,
Filter out unused or irrelevant code paths—the “noise” that overwhelms static tools.
This real-time, behavioral understanding is the only practical way to approach and successfully modernize megaliths.
What’s new in vFunction 4.4
Recognizing these profound challenges, vFunction’s new 4.4 release introduces a suite of capabilities to tackle megaliths.
Faster performance for deeper analysis of incredibly large codebases
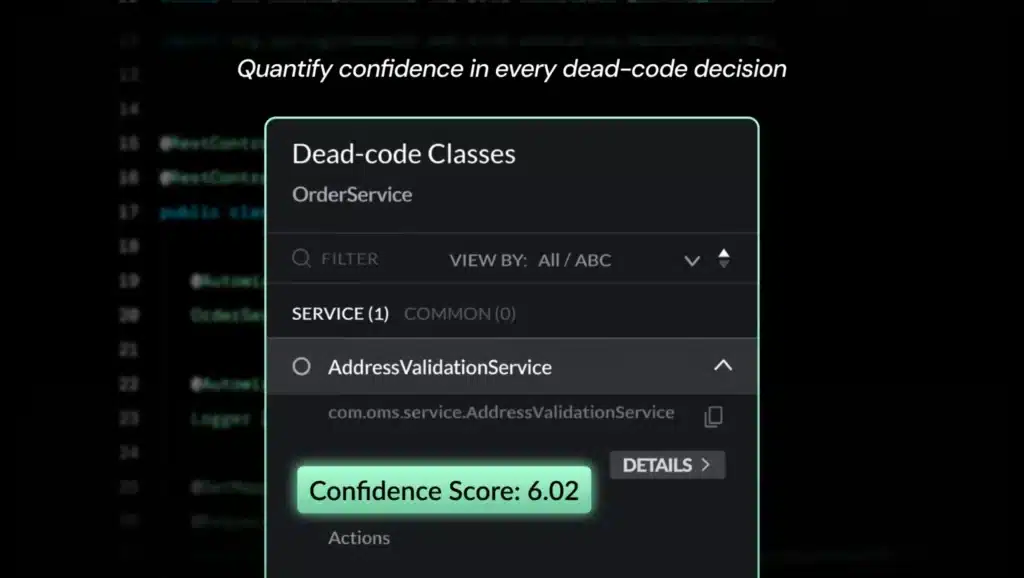
Greater transparency, exposing confidence levels in insights, such as dead-code identification and the anticipated impact of refactoring on overall architecture
Smarter noise filtering removes access to temporary files, unneeded resources, and other distractions, so focus stays on the core architecture
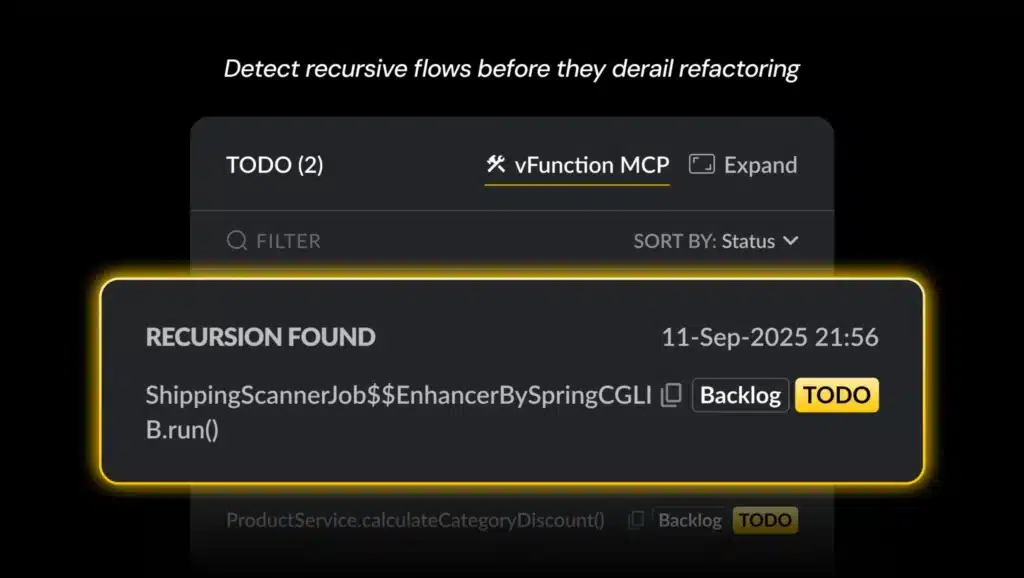
We also bolstered automatic refactoring through the use of prompts and GenAI by adding more to-do’s to expose new APIs, replace entry points, and refactor out recursions, among other improvements.
By providing granular, context-aware prompts, vFunction guides the GenAI engine to perform precise refactoring operations, ensuring the integrity and functionality of the modernized application. This uses dynamic analysis to focus the code assistant’s static analysis capabilities on the right thing, significantly reducing the time and effort required for large-scale refactoring. With these updates, the modernization of megalithic applications is not only possible but also efficient and predictable.
Press Release
vFunction Introduces GenAI-Powered Architectural Intelligence for Code Assistants
When your architecture is in the way of your AI transformation
Modernization is no longer just about optimizing existing systems. It’s about building the foundation for AI transformation. Enterprises are investing heavily in AI initiatives, but the success of these endeavors hinges on critical applications being flexible, well-architected, and understood.
Without a clear architectural blueprint, attempts to inject AI into business processes or leverage generative AI for development falter. AI models thrive on clean, well-defined data and clear operational boundaries—precisely the outcomes modernization aims to establish.
Modernizing megalithic applications isn’t a separate initiative or side project. It’s a prerequisite for unlocking the full potential of AI transformation within the enterprise.
vFunction Platform →
See how vFunction makes megalith-scale modernization possible
Application modernization funding is surging. More than half of enterprise IT spending will shift from traditional solutions to the cloud by 2025, driven by long-term modernization initiatives, according to Gartner. But here’s the uncomfortable truth: most of these well-funded projects will still fail.
The reason isn’t just a lack of resources or technical complexity. It’s that many organizations treat modernization like any other IT project—when in reality, it requires fundamentally different strategies. The patterns of failure are predictable, well-documented, and entirely avoidable if you know what to look for.
Why modernization projects are different
Traditional IT projects involve acquiring products, building applications, or implementing known technologies. Modernization is fundamentally different. You’re simultaneously dismantling existing systems while building new ones, managing technical debt while creating new capabilities, and transforming organizational practices while maintaining business continuity.
That complexity creates unique failure modes that catch even experienced IT teams off guard. Suboptimal approaches, inefficient processes, unexpected resistance, and project estimates that spiral out of control are the norm rather than the exception.
The good news? These pitfalls are entirely predictable. Here are the five most common traps and how to avoid them.
Pitfall 1: Treating modernization as purely technical
The problem: Organizations focus exclusively on technical transformation while ignoring the organizational changes required for success. They assume that if the technology works, the project succeeds.
But modern architectures require different skills, processes, and organizational structures (see table below). Moving from monoliths to microservices isn’t just a technical shift. It changes how teams collaborate, make decisions, and take ownership.
“It’s not really about having the tools, but frankly having the culture and capabilities in your organization to use those tools to make a difference to your customer and any other stakeholder you care about.”
The skills gap makes this harder. As legacy technologies fall out of favor and experienced developers retire, organizations struggle to find talent familiar with outdated systems. Meanwhile, teams lack expertise in modern architectural patterns, creating a dangerous knowledge vacuum during critical transitions.
The solution: Invest in organizational change alongside technical changes. This means comprehensive training programs, mentorship for new architectural patterns, and evolving business processes to match new technical capabilities. Most importantly, establish clear governance models and ownership structures for distributed architectures before you need them.
Close the skills gap by cross-training existing team members and bringing in external expertise during the transition period. Don’t assume teams can learn new architectural patterns while executing complex migrations.
Managing a monolith vs. a distributed architecture
Area
Monolith
Distributed (Microservices, etc.)
Deployments
All modules ship together, slower cadence
Independent deployments per service, faster but harder to coordinate
Testing
Single test suite, easier integration coverage
Requires contract tests, end-to-end tests across many services
Debugging & Troubleshooting
One process, stack traces are straightforward
Failures span services; needs distributed tracing and correlation IDs
Observability
Central logs and metrics
Per-service logs/metrics/traces, stitched together
Resilience
In-process exceptions, retries
Network failures, circuit breakers, timeouts, retries, service meshes
Scale each service independently, isolate hotspots
Team Ownership
One team or tightly coupled groups
Many teams own services; requires strong ownership boundaries
Governance & Drift
Architecture evolves slowly, easier to enforce
Rapid drift risk; needs guardrails, policy-as-code, and ongoing governance
Pitfall 2: The “modernized legacy” trap
The challenge: Many organizations choose lift-and-shift or replatforming approaches that move applications to modern infrastructure without addressing underlying architectural limitations. Microsoft’s 2025 survey found that 74% of workloads that have already migrated are candidates for modernization, indicating that most initial migrations fail to fully leverage cloud-native capabilities. This creates “modernized legacy systems” that run on cloud platforms but perpetuate the same operational constraints as the original monoliths.
These systems look modern on paper, but fail to deliver the scalability, agility, and cost benefits that drove the modernization initiative. “Cloud shock” is a term some use when they move to the cloud, but don’t realize its benefits. Too often, organizations end up with higher infrastructure costs and the same deployment bottlenecks, integration challenges, and maintenance burdens they started with.
The solution: Recognize that true modernization requires architectural transformation, not just infrastructure migration. Lift-and-shift can provide short-term benefits like improved availability and centralized management, but it should be viewed as a stepping stone, not the end goal.
Plan for deeper refactoring or rebuilding efforts that address core architectural constraints present in your application. Focus on breaking down monolithic structures, implementing proper service boundaries, and adopting cloud-native patterns that enable real scalability and operational efficiency.
>>See how vFunction helps teams move from monoliths to microservices
Pitfall 3: Trying to modernize everything
The challenge: Counter to the previous pitfall, some organizations over modernize. A blanket “modernize everything” approach often targets ideal architectures rather than actual problems. This creates extra modernization tracks, inflates costs, increases operational overhead and causes projects to stall or fail.
The solution: Modernization should be problem-driven and value-led: prioritize the smallest set of changes that directly solve the KPI you care about. Avoid broad, generic rewrites or unnecessary architectural granularity. Some examples:
If engineering velocity is the constraint: Decompose the monolith into a few independently testable modules, add CI/CD and automated tests for those modules. No full infrastructure rewrite required.
If database licensing costs drive the change: Migrate to a lower-cost database engine or tier. There is no need to containerize or re-architect the whole application.
If scalability/resilience is the issue: Split into a minimal number of “macro” services that must scale independently. Avoid overly fine-grained domain splits that increase operational burden.
If the UI needs modern APIs: Expose a modern facade layer (e.g. replace Struts Actions with Spring Web Controllers) rather than converting the entire backend into microservices.
Keep modernization lean, measurable, and tightly scoped. Modernize to solve validated problems, not to chase theoretical purity.
Pitfall 4: Losing architectural visibility
The challenge: As applications become more distributed through modernization, maintaining architectural oversight becomes exponentially harder. What starts as a clear transformation plan quickly becomes an unmanageable web of services, dependencies, and integration points.
Teams lose track of how components interact, which services own what data, and how changes in one area impact others. This architectural drift creates operational complexity that can exceed the benefits of modernization itself.
The problem is compounded by microservices sprawl. Teams new to microservices often overcorrect, creating too many poorly designed services without proper governance. What should be a carefully planned decomposition becomes an explosion of small services that are harder to manage than the original monolith.
The solution: Build observability into your modernization strategy from day one. Establish governance frameworks and standards before you start decomposing monoliths. Keep documentation and architectural decision records current, not as an afterthought, but as a core deliverable.
Define clear service boundary guidelines based on business domains, not technical convenience. Establish consistent operational patterns and automation from the start. Implement strong data management and consistency strategies before you need them. Actively monitor and document service relationships and dependencies. Complexity will grow faster than you expect.
The challenge: Most modernization efforts focus on current needs without considering how applications will need to evolve to support AI capabilities. The result: technical debt that forces another round of modernization just as the first one ends.
AI demands architectures that support real-time data processing, rapid API integrations, and continuous deployment. Even replatformed legacy systems often lack the architectural flexibility needed for these workloads.
Organizations that don’t plan for AI integration find themselves needing another round of modernization just as they finish the first one. This is particularly problematic given the rapid pace of AI advancement and the competitive advantages it provides.
The solution: Build AI readiness into your modernization strategy from the start:
Design for real-time data access
Embrace API-first architectures vs older protocols/methods, and
Opt for deployment patterns that support rapid iteration and testing.
Think ahead: how will your applications connect with AI services, process streaming data, and adapt through continuous learning? Plan for these capabilities now so you’re ready when the business needs them.
Getting modernization right
The difference between successful and failed modernization projects often comes down to preparation and perspective. Technical challenges are solvable with the right tools and expertise. Organizational challenges require intentional design and sustained commitment. Adopt the “Minimum Viable Modernization” mindset. Implement the smallest change that materially improves the target KPI. Modernize incrementally – measuring benefits after every iteration.
Start by acknowledging that modernization will change how your organization works, not just what technology it uses. Plan for that change, invest in it, and measure its impact alongside your technical metrics.
vFunction’s architectural modernization approach helps organizations avoid these traps by focusing on the architecture itself—the real source of modernization complexity. By automatically analyzing application dependencies and surfacing architectural debt, vFunction gives teams visibility into what needs to change, why it matters, and how to tackle it in manageable steps. And by providing architectural context to GenAI code assistants, vFunction helps engineering teams refactor faster, with less risk, while reducing the manual burden of modernization. This not only lowers risk and rework but also turns modernization into a repeatable, measurable process instead of a one-off, high-stakes gamble.
With $1.5 million average project costs and high failure rates, organizations can’t afford to repeat the same mistakes. The organizations increasing their modernization budgets in 2025 have the right instinct. But a budget alone won’t guarantee success. Understanding these pitfalls and designing around them from the start will.
Modernization doesn’t have to feel overwhelming. Learn how vFunction helps teams simplify the process and deliver results faster. Read the case studies ›
In August 2024, vFunction was named a Gartner® Cool Vendor in AI-Augmented Development and Testing. The recognition validated our vision for modernizing application architecture—providing deep visibility into an application’s structure and proactively addressing architectural technical debt. This transforms monoliths into modular microservices-based apps that boost scalability and engineering velocity. One year later, with the rise of GenAI coding assistants like Amazon Q Developer and GitHub Copilot, this recognition feels even more relevant—cementing architectural modernization as a critical enabler of AI-augmented development.
AI is transforming how software gets built. It can generate code, suggest fixes, and even refactor functions. But AI works at the code level, not the system level. Without understanding runtime behavior, GenAI risks making complexity worse, unable to understand the logical domains and how to best modularize the code..
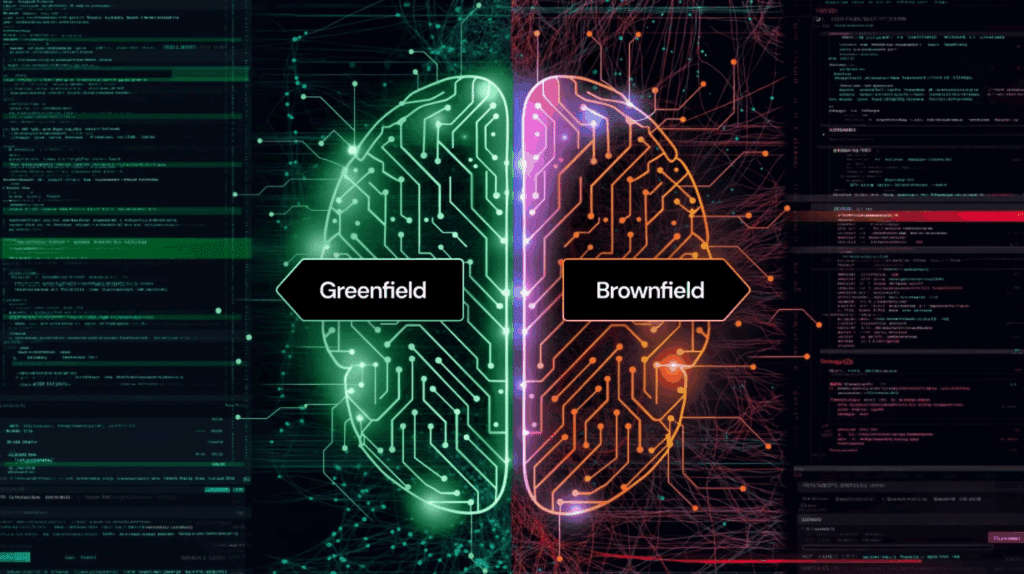
The brownfield reality
This challenge is especially acute for brownfield applications. Unlike greenfield projects, which represent a small fraction of what enterprises run today, the vast majority of critical systems are brownfield: large, complex applications with years of accumulated dependencies, complex flows, and architectural drift. Recent stats show that more than 60% of IT budgets is spent simply maintaining these systems. These are the critical apps that drive revenue, support operations, and enable customer experiences.
At the extreme end are the “megaliths”—applications with over 20,000 classes and more than 10 million lines of code. These applications are so large and tangled that even incremental change feels daunting. Some teams have already lifted and shifted them to the cloud, but their monolithic nature prevents them from realizing the cloud benefits. Others are still in the process of migrating and face the same challenge.
At that scale, small inefficiencies multiply quickly, slowing engineering velocity and triggering resiliency issues. Simple containerization—or relying on code assistants without architectural context—can’t address the complexity, modularize the code, or truly solve these problems.
Why architectural context matters
That’s why architectural context is essential. Without it, GenAI can’t solve the challenge of modularization—breaking monoliths into smaller, well-structured services. This is critical for taking full advantage of cloud-native services and reducing complexity and technical debt.
Without runtime-based architectural context, GenAI struggles to:
Scale: ingest or analyze large code bases (e.g., 2M+ lines of code)
Understand dependencies: It only reads code, missing runtime behavior
Recognize system-wide structures like context, components, and business or logical domains.
With it, breaking monoliths into modular services or microservices becomes not only possible, but predictable and successful.
Analysts expect the global market for modernization services to grow from US$19.82 billion in 2024 to US$39.62 billion by 2030, expanding at a 15% CAGR. By bringing architectural context into the GenAI era, we ensure that coding assistants like Amazon Q Developer and GitHub Copilot aren’t just generating more code, but are helping teams refactor dependencies, modularize monoliths, and extract and transform services—the real work of sustainable modernization.
Making developers’ lives easier
Since our original recognition, we’ve continued to build toward this future—expanding our platform to focus on the architectural modernization of today’s megaliths.
Architectural modernization transforms monoliths into modular domains or microservices, allowing workloads to leverage cloud-native services like Amazon EKS, Lambda, and Azure Functions—harnessing the scalability, elasticity, lower costs, and faster innovation of the cloud.
The opportunity is so massive and so critical to how enterprises and ISVs will evolve that we’ve made it a primary focus of our strategy. Since our original recognition, we’ve expanded our platform to focus on the architectural modernization of monoliths—extending to today’s massive megaliths—and bringing architectural context into the GenAI era.
Deepening our work with cloud partners
At the same time, we’ve broadened our collaboration with hyperscalers AWS and Microsoft, taking on new competencies and joining programs like AWS Workload Migration and ISV Accelerate. These partnerships not only validate our approach but also fund licenses for vFunction to support architectural modernization efforts, making the path forward faster and more cost-efficient for our customers.
GenAI-powered remediation
What does all this mean for developers at the heart of our Cool Vendor recognition for AI-augmented development? This means less time wrestling with legacy complexity and more time building features that matter.
Using our Visual Studio Code extension or MCP (Model Context Protocol) server, vFunction bridges the gap between architecture and code assistants, making architectural transformation fast, actionable, and fully embedded in the SDLC. The sweeping made over the past year allow vFunction to connect to modern developer environments, enabling teams to:
Trigger fixes—all from the command line or inside their IDE
By surfacing the architecture in real time and guiding AI code assistants with context, vFunction helps developers move faster, avoid rework, and keep technical debt in check. And through integrations with Jira and Azure DevOps, vFunction pushes prioritized architectural to-dos straight into the backlog, ensuring nothing gets lost between discovery and execution, and automatically validates that remediations are completed.
From Cool Vendor to critical capability
When we were recognized as a Cool Vendor in 2024, architecture in the SDLC was still emerging. In today’s AI-driven landscape, it has become essential. AI alone isn’t enough. But AI + architecture is a powerful combination; one that equips organizations to innovate faster, modernize with confidence, and build resilient, scalable applications for the cloud.
And it’s not just theory. We’re now helping enterprises and ISVs tackle some of the world’s largest applications in automotive, financial services, telecom, and manufacturing, to name a few—modernizing them into modular, cloud-ready systems. If a 10-million-line megalith can be transformed, any system can. With the right architectural context, no application is too complex to modernize.
At vFunction, that’s the future we’re helping our customers create every day.👉 Ready to see how architectural modernization empowers AI-augmented development? [Request a demo]
Application modernization used to be every CTO’s nightmare—months of manual code analysis, reliance on tribal knowledge, and expensive refactoring projects with sky-high failure rates. All this, while putting critical new features on hold.
Today, artificial intelligence is fundamentally changing the game, turning modernization from a risky, resource-intensive process into a strategic competitive advantage. AI budgets continue to grow rapidly across organizations, driven by new internal and customer-facing use cases, as well as the push to modernize legacy systems to support AI adoption in many enterprises.
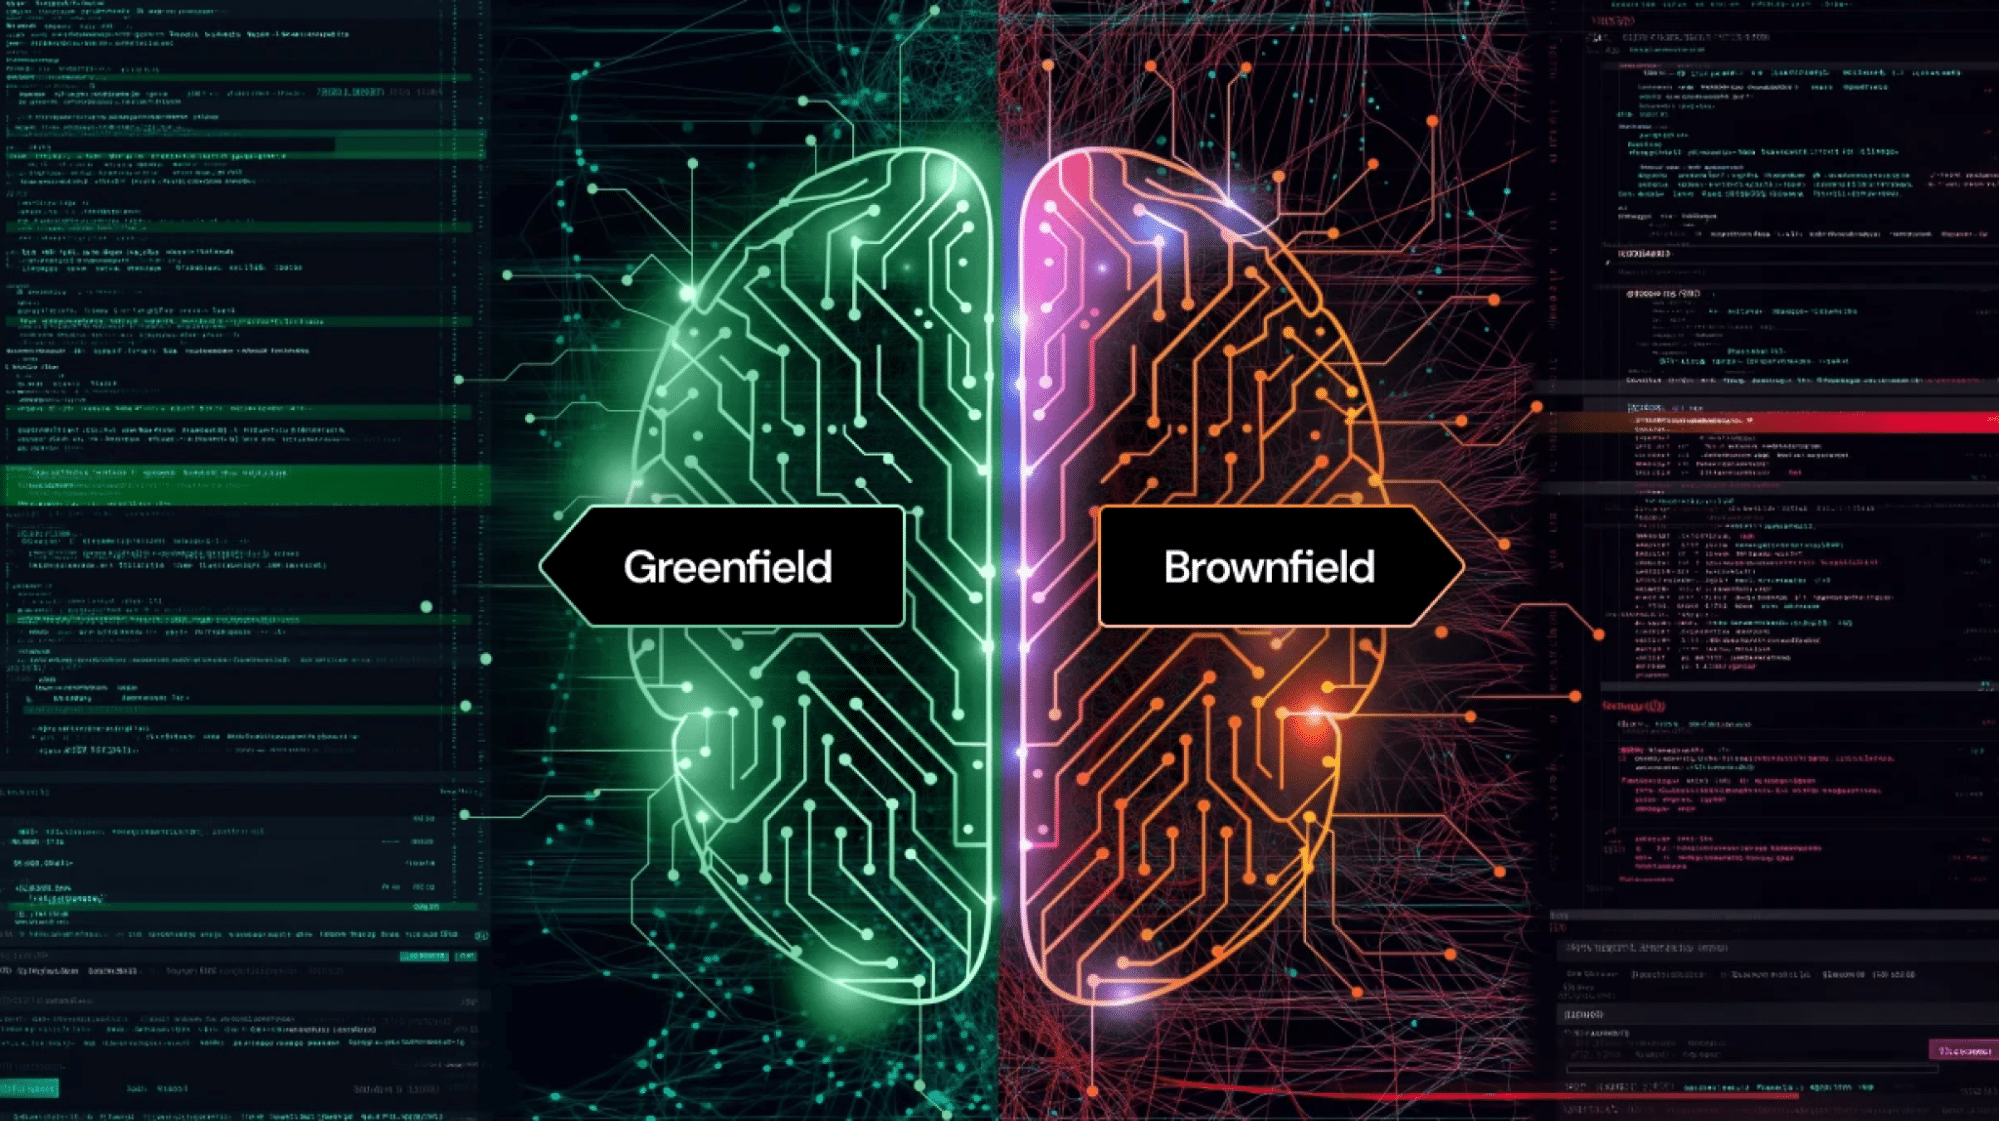
But the impact of AI varies dramatically depending on whether organizations are working with greenfield projects or brownfield legacy systems, which most enterprises rely on.
The brownfield challenge
While much of the AI hype focuses on greenfield development, mainly building new applications from scratch, the enterprise reality is overwhelmingly brownfield: maintaining and continuously adding features to legacy applications, packed with technical debt, undocumented business logic, and complex interdependencies.
Introducing AI agents to the development lifecycle of such applications creates an integration paradox: AI agents excel at generating new code and finding local issues in existing code, but they often lack architectural context to understand the ripple effects of how changes impact the entire system and whether or not the changes are consistent with the overall architectural design of the system. A service can be “optimized” in isolation, which can unknowingly destabilize the system elsewhere and introduce new technical debt.
That’s why a deep understanding of the existing systems before implementing changes is crucial for AI-powered modernization success.
The dual AI integration imperative
Introducing AI to complex legacy systems is one aspect of modernization and requires architectural changes and redesign, which in itself can be expedited using AI.
Businesses now require AI in the applications they build and run. Modern applications need architectures that can rapidly integrate emerging AI capabilities—think real-time data processing, predictive analytics, API ecosystems, and adaptable behavior envelopes.
Legacy systems, however, struggle to keep pace. Many enterprises are now increasing investment in modernizing decades-old systems to ensure they can support AI-driven workloads, with some even reengineering mainframes to work alongside new AI capabilities.
According to McKinsey, generative AI can accelerate modernization timelines by 40–50% and cut tech-debt-related costs by about 40%, delivering speed and efficiency gains that fundamentally shift the calculus. Deloitte also underscores that AI-driven modernization is reshaping core enterprise systems, enabling real-time, data-driven decision-making that was previously impossible.
This creates a compelling dual imperative: use AI to modernize faster, and modernize so you can leverage AI effectively.
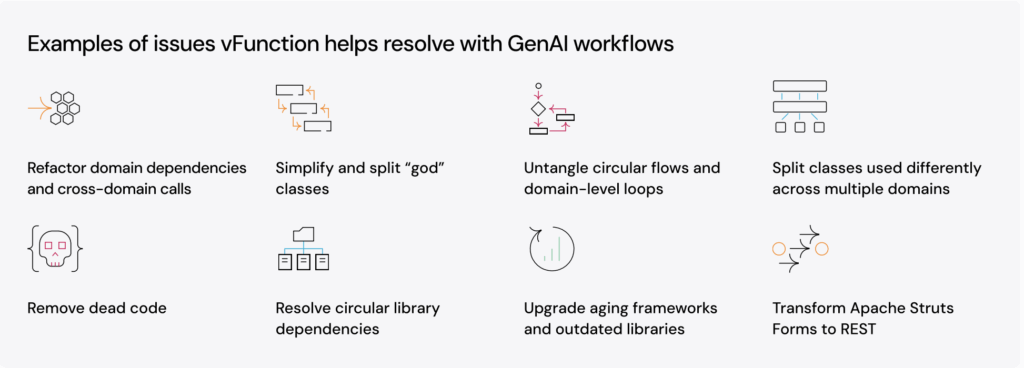
AI tools for application modernization
Enterprise teams are using AI-assisted coding platforms to accelerate modernization in brownfield applications, where manual refactoring is too slow or costly. But most GenAI tools aren’t purpose-built for application modernization.
Where coding tools shine, and where they fall short
This creates a significant gap between what these tools can generate and what legacy systems need. Popular AI coding assistants like GitHub Copilot, Cursor, Windsurf, and Amazon Q Developer excel at refactoring and adding new code in the context of individual functions or components. They can rapidly generate boilerplate code, suggest optimizations, and even help with complex algorithms. In modernization projects, teams are increasingly using these tools to accelerate refactoring tasks. Tasks that used to be very resource-heavy, such as converting legacy code patterns to modern frameworks, updating deprecated APIs, and even translating between programming languages, have become more manageable.
But in brownfield environments, writing good code is only half the battle. Just as human software developers benefit from architectural guidance to ensure their code adheres to scalability, maintainability, and system integration principles, AI coding tools need similar architectural intelligence. A human architect reviews code and design not just for syntax or efficiency, but for how it fits within the broader system, whether it respects service boundaries, follows established patterns, and maintains the integrity of existing business logic.
AI coding tools, operating without this architectural context, can inadvertently suggest changes that optimize one component while destabilizing another. They might recommend modern patterns that conflict with legacy dependencies, or generate code that looks clean but breaks critical business workflows that aren’t immediately obvious from the codebase alone. This is particularly problematic in modernization scenarios where seemingly outdated code patterns may deliver essential functionality.
Closing the gap with architecture-aware AI
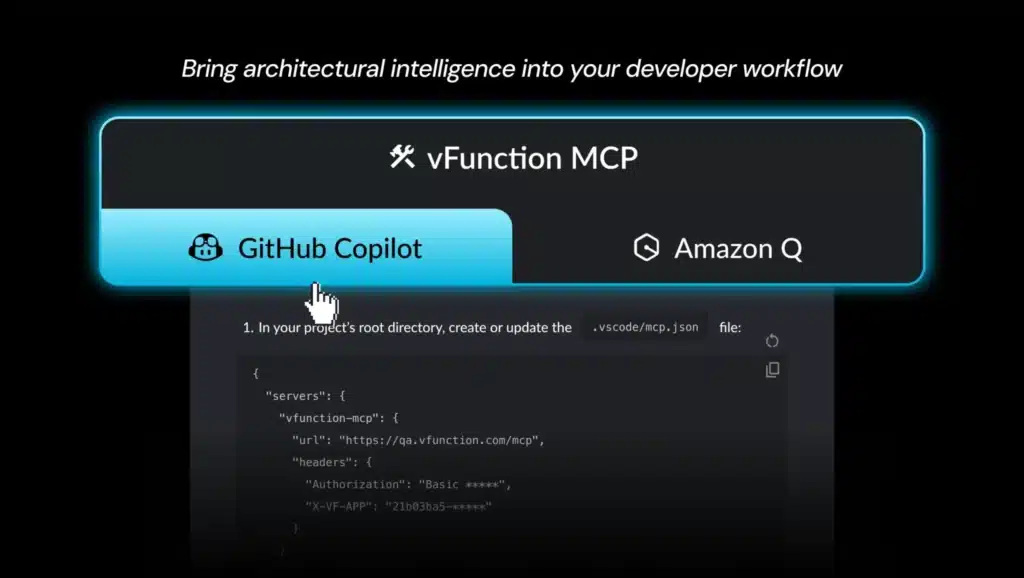
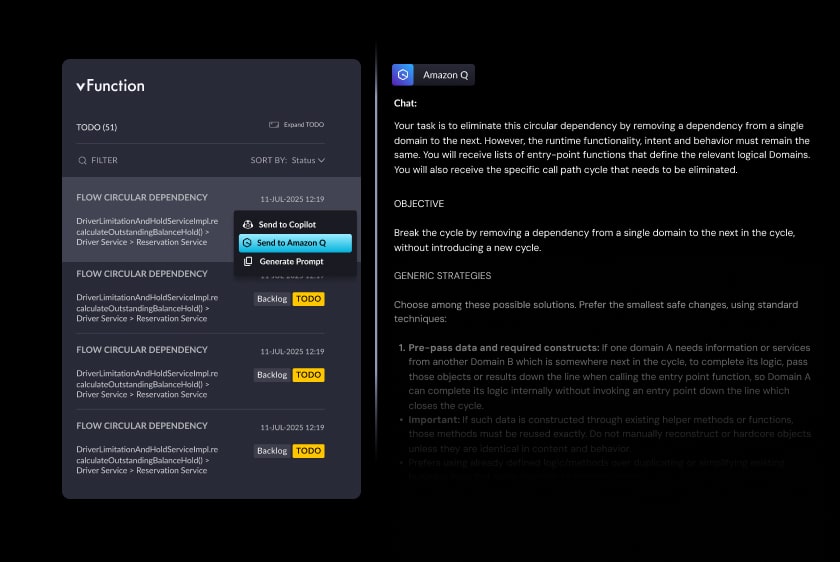
The solution lies in bridging this gap between AI code generation and architectural intelligence. Platforms like vFunction are now addressing this challenge by integrating directly with AI coding tools through protocols like MCP (Model Context Protocol) and through integration via IDE plugins.
The above figure illustrates the integration at a high level: vFunction feeds precise, contextual prompts into the coding assistants, transforming them into architecture-aware modernization partners. The prompts can be fed either via a vFunction IDE extension/plugin that reads the architectural tasks (TODOs) from vFunction and sends the prompts to the AI coding assistant, or the user can copy the prompts directly from the vFunction Web UI and paste them to the AI Code Assistant. The AI coding assistance can get additional context using the standard MCP protocol by communicating with the vFunction remote MCP server. This enables the AI Coding Assistant to receive specific, detailed instructions about what can be safely modified, which dependencies must be preserved, and how to maintain system integrity throughout the refactoring process.
This architectural guidance transforms how AI coding tools operate in modernization contexts, enabling them to make informed decisions that respect both technical constraints and business requirements. But what exactly does this architectural intelligence entail, and why is it so critical for modernization success?
Why AI needs architectural context
In brownfield environments, success depends on:
Understanding both the static structure and the dynamic behavior of the application.
Identifying hidden dependencies, architectural drift, and anti-patterns before changes are made.
Knowing why certain dependencies exist so that fixes don’t break critical business functions.
As we’ve already discussed, without this level of insight, AI risks accelerating the wrong changes, introducing new technical debt, or breaking mission-critical systems. The real power comes when AI understands the architecture, not just the code.
AI’s three-pronged impact
Understanding your architecture is the first critical step in modernization, and this is where AI-powered platforms are changing the game. The most effective solutions combine deep static code analysis with dynamic runtime insights to surface hidden dependencies, architectural drift, and technical debt that would take human experts weeks to uncover.
vFunction AI-powered modernization strategies focus on three critical areas:
1. Architectural discovery and analysis
vFunction analyzes large complex applications in minutes, surfacing hidden dependencies, architectural drift, and technical debt that would take human experts weeks to identify. By combining static analysis with runtime data (dynamic analysis), vFunction provides multiple detailed views of the operational behavior and structure of the application, how it uses external resources such as databases and network sockets, along with opinionated analytics identifying the architectural technical debt and the various functional domains.
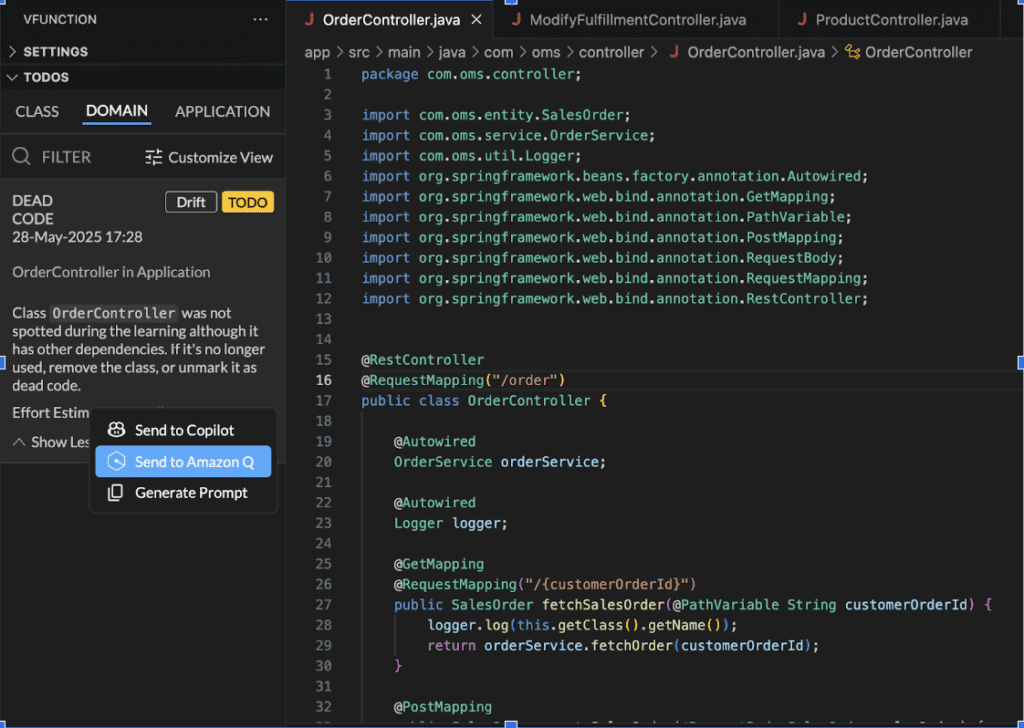
2. Context-aware AI-based code refactoring
Using the architecture-aware detailed prompts provided by vFunction, AI code assistants can refactor code that aligns with your system’s intent, follows established patterns, and respects service boundaries. It’s not just about writing faster code; it’s about maintaining architectural integrity while accelerating delivery.
The key difference lies in context. When AI assistants understand the broader system architecture, they can generate code that integrates seamlessly rather than creating new technical debt. They can enforce architectural constraints automatically, ensuring generated code follows company standards and best practices without human oversight.
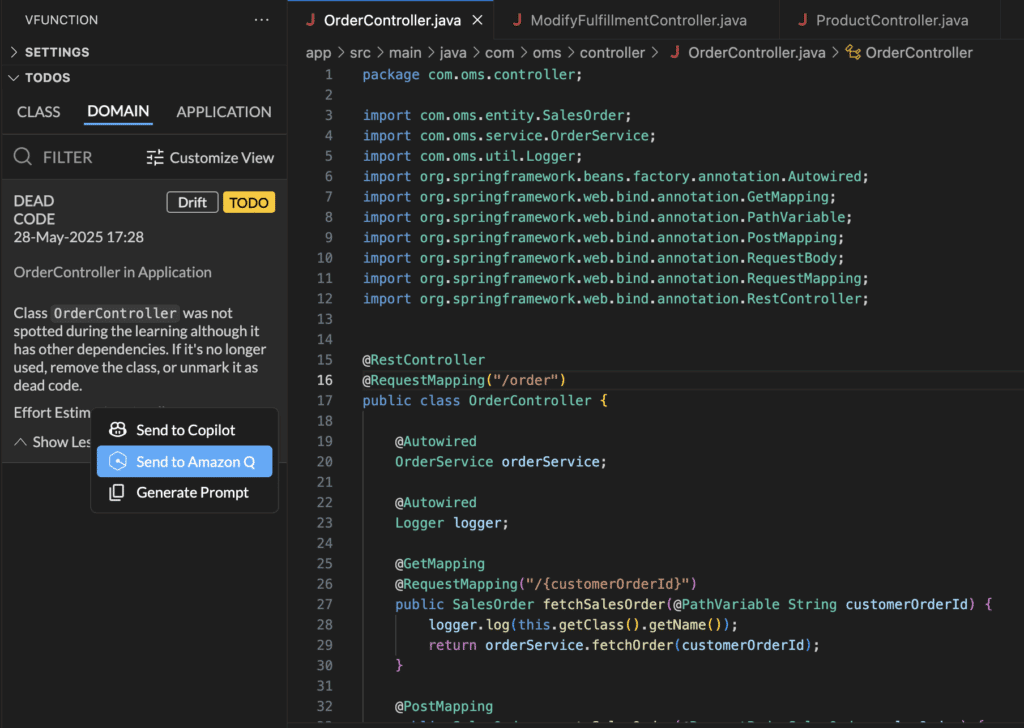
In the above screenshot, we see a TODO task derived from vFunction analysis (displayed in the vFunction extension in VSCode) and how a detailed prompt can be sent to an AI coding assistant in the context of the code within the IDE.
3. Strategic decision making
AI doesn’t just execute; it can also provide the basis for the application experts to make informed decisions. By identifying high-risk areas and continuously learning from each project, vFunction uses AI to help teams prioritize what to modernize first and how to sequence complex transformations for maximum impact.
This includes sophisticated risk assessment capabilities that evaluate current vulnerabilities within application portfolios and determine optimal modernization sequences. AI can suggest mitigation strategies for identified issues and provide data-driven recommendations on resource allocation and timeline planning.
Democratizing modernization expertise
With 79% of modernization projects experiencing failures, mainly due to skills and process challenges, AI assistants using architectural intelligence are becoming critical for project success. AI can provide expert-level guidance on architectural decisions, help junior team members understand complex legacy systems, and offer real-time recommendations based on industry best practices.
For experienced teams, AI can easily 10x output, shortening timelines and dramatically improving success rates. What once required months of manual analysis can now be completed in days, with higher accuracy and deeper insights than traditional approaches.
The bottom line
AI is becoming essential to modernization. Organizations that embrace AI-powered modernization will gain significant advantages in speed, cost, and success rates, while those that rely on traditional manual approaches will find themselves increasingly disadvantaged.
The convergence is apparent: AI demands modern architectures, and AI enables faster modernization. Organizations that recognize this dual relationship and act on it will build application portfolios that don’t just meet today’s requirements, but can rapidly adapt to whatever comes next.
The question isn’t whether AI will transform modernization—it already has. The question is whether your organization will provide the necessary architectural context to make the right changes, in the right places, without introducing new risks.
Ready to explore how AI can accelerate your modernization efforts? Download our complete App Modernization Buyer’s Guide for comprehensive strategies, vendor analysis, and implementation frameworks.
Application modernization has evolved from a strategic consideration to an urgent business necessity. It’s a massive, industry-wide challenge. Analysts expect the global market for modernization services to grow from US$19.82 billion in 2024 to US$39.62 billion by 2029, expanding at a 15% CAGR. This explosive growth reflects the urgent need to address sprawling legacy portfolios that have become operational liabilities.
This challenge goes well beyond individual applications. It spans the entire enterprise technology stack. Legacy COBOL, Java, and .NET systems, many built on frameworks from the 2000s or earlier, still power core business functions but demand outsized maintenance. Designed for a different era, these applications lack the flexibility needed for modern, cloud-native operations and innovation.
At the heart of every modernization effort is the architecture. Not the physical infrastructure of the past—servers, cables, and rack diagrams. Software architecturecomprises the business logic, service interactions, and code structures that define how applications function. When it’s well-structured, software architecture accelerates deployment, simplifies debugging, and supports seamless scaling. But when it drifts, everything gets harder—releases, troubleshooting, scaling, even understanding where one application ends and another begins.
Five converging market forces are reshaping the competitive landscape, making aging application architectures an even greater liability. Organizations that postpone modernization initiatives face mounting operational risks, security exposure, and a growing inability to keep pace as digital transformation outstrips the limits of traditional enterprise systems.
Understanding these converging forces is essential for any organization evaluating its modernization strategy. Each force creates a compelling business case on its own, but together they make modernization an urgent industry-wide imperative.
1. Security vulnerabilities and regulatory compliance challenges
Legacy applications constitute the most significant attack surface within modern enterprise environments. ServiceNow research indicates that 71% of organizations acknowledge that legacy systems substantially increase cybersecurity vulnerabilities, as aging applications lack contemporary security frameworks and create exploitable attack vectors that compromise enterprise data integrity.
Security challenges extend beyond technical vulnerabilities to encompass regulatory compliance requirements. Legacy applications frequently lack support for modern authentication protocols, current encryption standards, and comprehensive audit trails mandated by regulations, including GDPR, CCPA, SOC, SOX, ISO/IEC 27001, and industry-specific compliance frameworks. This creates enterprise-wide risk exposure that impacts operations far beyond IT infrastructure.
2 . Escalating operational costs
Legacy systems are consuming disproportionate shares of enterprise IT budgets. Industry analysis suggests that maintaining aging systems requires 60–80% of enterprise IT spending, constraining resources available for innovation initiatives. Gartner® research indicates that in 2025, companies are allocating 40% of IT budgets toward managing technical debt. Deloitte findings reinforce this trend, demonstrating that over 55% of technology budgets focus on maintaining operational systems, while only 19% support new solution development.
These maintenance costs continue to escalate as:
Experienced developers with legacy technology expertise retire or transition to other roles
Integration complexity increases across aging system architectures
Infrastructure dependencies create operational brittleness and reduced flexibility
Legacy applications can’t fully leverage cloud-native capabilities, such as auto-scaling, managed services, and global distribution, without significant architectural changes. Organizations that simply lift and shift miss out on the efficiency, scalability, and cost benefits the cloud is designed to deliver.
Cloud transformation isn’t just about infrastructure migration. To be effective, it requires architectural patterns that enable rapid scaling, geographic distribution, and service resilience.
Contemporary cloud-native architectures typically rely on microservices deployed in containerized environments across Kubernetes clusters, supported by event-driven messaging systems and global load balancing capabilities. These architectures enable seamless scaling, failure isolation, and dynamic response to user demand patterns. As such, cloud migration is often the trigger for architectural modernization.
As a result, cloud migration often becomes the catalyst for architectural modernization. Organizations that remain on monolithic architectures—whether on-prem or in the cloud—struggle to match the agility, scalability, and efficiency of cloud-native competitors.
4 . Velocity limitations
Current market conditions require continuous feature deployment rather than traditional monthly, quarterly, or annual release cycles. Legacy architectures lack the foundational capabilities to support this level of change velocity and innovation pace, directly affecting competitive positioning. In monolithic systems, minor updates frequently require complete codebase rebuilding and redeployment, a time-intensive, high-risk process that makes frequent releases impractical. Research shows that 47% of organizations identify legacy software limitations as the primary obstacle to digital transformation success.
Without modernized architectures supporting continuous integration, automated testing capabilities, and rapid deployment processes, organizations cannot respond effectively to market opportunities or evolving customer requirements. This architectural constraint becomes a strategic business limitation that compounds over time.
5 . AI integration requirements
Artificial intelligence capabilities are no longer optional; they’re becoming table stakes for contemporary applications. But AI functionality requires architectures that can ingest and process real-time data, integrate rapidly with new services, and adapt behavior based on continuous insights. Legacy systems weren’t built for this. They lack the flexibility, agility, and scalability needed for dynamic, data-driven workloads that AI implementations introduce.
Take AI-powered chatbots or real-time fraud detection services: both require seamless external API integration, real-time data access capabilities, and rapid deployment cycles. In tightly coupled monolithic systems, these demands are difficult, if not impossible, to meet.
When organizations attempt to retrofit legacy systems for AI capabilities, extended modernization timelines often render AI features obsolete before deployment completion, particularly problematic in rapidly evolving AI markets. To capitalize fully on AI innovation opportunities, organizations require modern application architectures capable of quickly integrating emerging AI capabilities.
Industry-specific modernization pressures
While these five forces affect all organizations, certain industries face particularly acute modernization challenges due to regulatory requirements, competitive dynamics, and operational complexities. Understanding these sector-specific pressures provides insight into the varying urgency and approaches required for successful modernization initiatives.
Many financial institutions continue operating core banking systems up to 40 years old on mainframe hardware, creating compliance risks and limiting digital innovation capabilities. The Federal Reserve Bank of Kansas City notes that these legacy systems create difficulties accommodating modern services, including open banking and instant payments. At the same time, fintech competitors capture 47% of new account openings.
Healthcare and life sciences organizations
Healthcare organizations must balance modernization initiatives with strict regulatory compliance requirements. Legacy patient data systems and research platforms create security vulnerabilities while limiting integration capabilities necessary for modern care delivery models. As security breaches increase in frequency and impact, they represent life-threatening crises, disrupting critical systems and entire communities. The COVID-19 pandemic accelerated digital health adoption, exposing significant limitations in legacy healthcare IT infrastructure.
Manufacturing and government sectors
Manufacturing organizations require modernization to support Industry 4.0 initiatives, IoT integration capabilities, and supply chain digitization. Government agencies face similar pressures as citizen service expectations increase while legacy systems struggle to support modern digital service delivery requirements. Limited resources, complex budget cycles, and outdated systems make modernization particularly challenging in both sectors. The fundamental challenge extends beyond identifying modernization targets to implementing scalable, efficient, and mission-aligned modernization approaches.
Strategic business implications and the path forward
The convergence of these technical, operational, and competitive forces makes modernization a strategic imperative. It’s not just about improving system performance; it’s about gaining the fundamental advantages that shape market leadership and long-term success.
Organizations implementing systematic modernization strategies gain critical competitive advantages: enhanced security postures, lower operational costs, scalable cloud-native architectures, faster innovation cycles, and AI-ready architectural foundations. Organizations that delay modernization initiatives will experience increasing competitive disadvantages as these performance gaps expand.
The most successful modernization initiatives will be those that approach architectural transformation systematically, with a clear understanding of both the technical requirements and business imperatives driving change. In this environment, modernization becomes the foundation upon which all other digital transformation initiatives depend.
That’s where vFunction helps. Our platform empowers engineering teams to visualize software architecture, identify and eliminate technical debt, and accelerate modernization with precision and scale. In this environment, architecture becomes more than a technical concern; it’s the foundation for everything organizations need to build, scale, and innovate.
This post is the first in our App Modernization Series. In the coming weeks, we’ll explore how AI is changing modernization, how to build your strategy, and how to prioritize what to modernize and when.Stay tuned, and if you don’t want to miss a post, be sure to sign up for more pieces like this from vFunction.
Most of us were excited about coding with AI assistants not too long ago. Although not always exactly matching what we were looking for, tools like GitHub Copilot provided us with entire blocks of code suggestions to help us complete tasks more rapidly. Beyond the confines of most auto-completion, these assistants helped developers write code at what we thought was, at the time, immense speed.
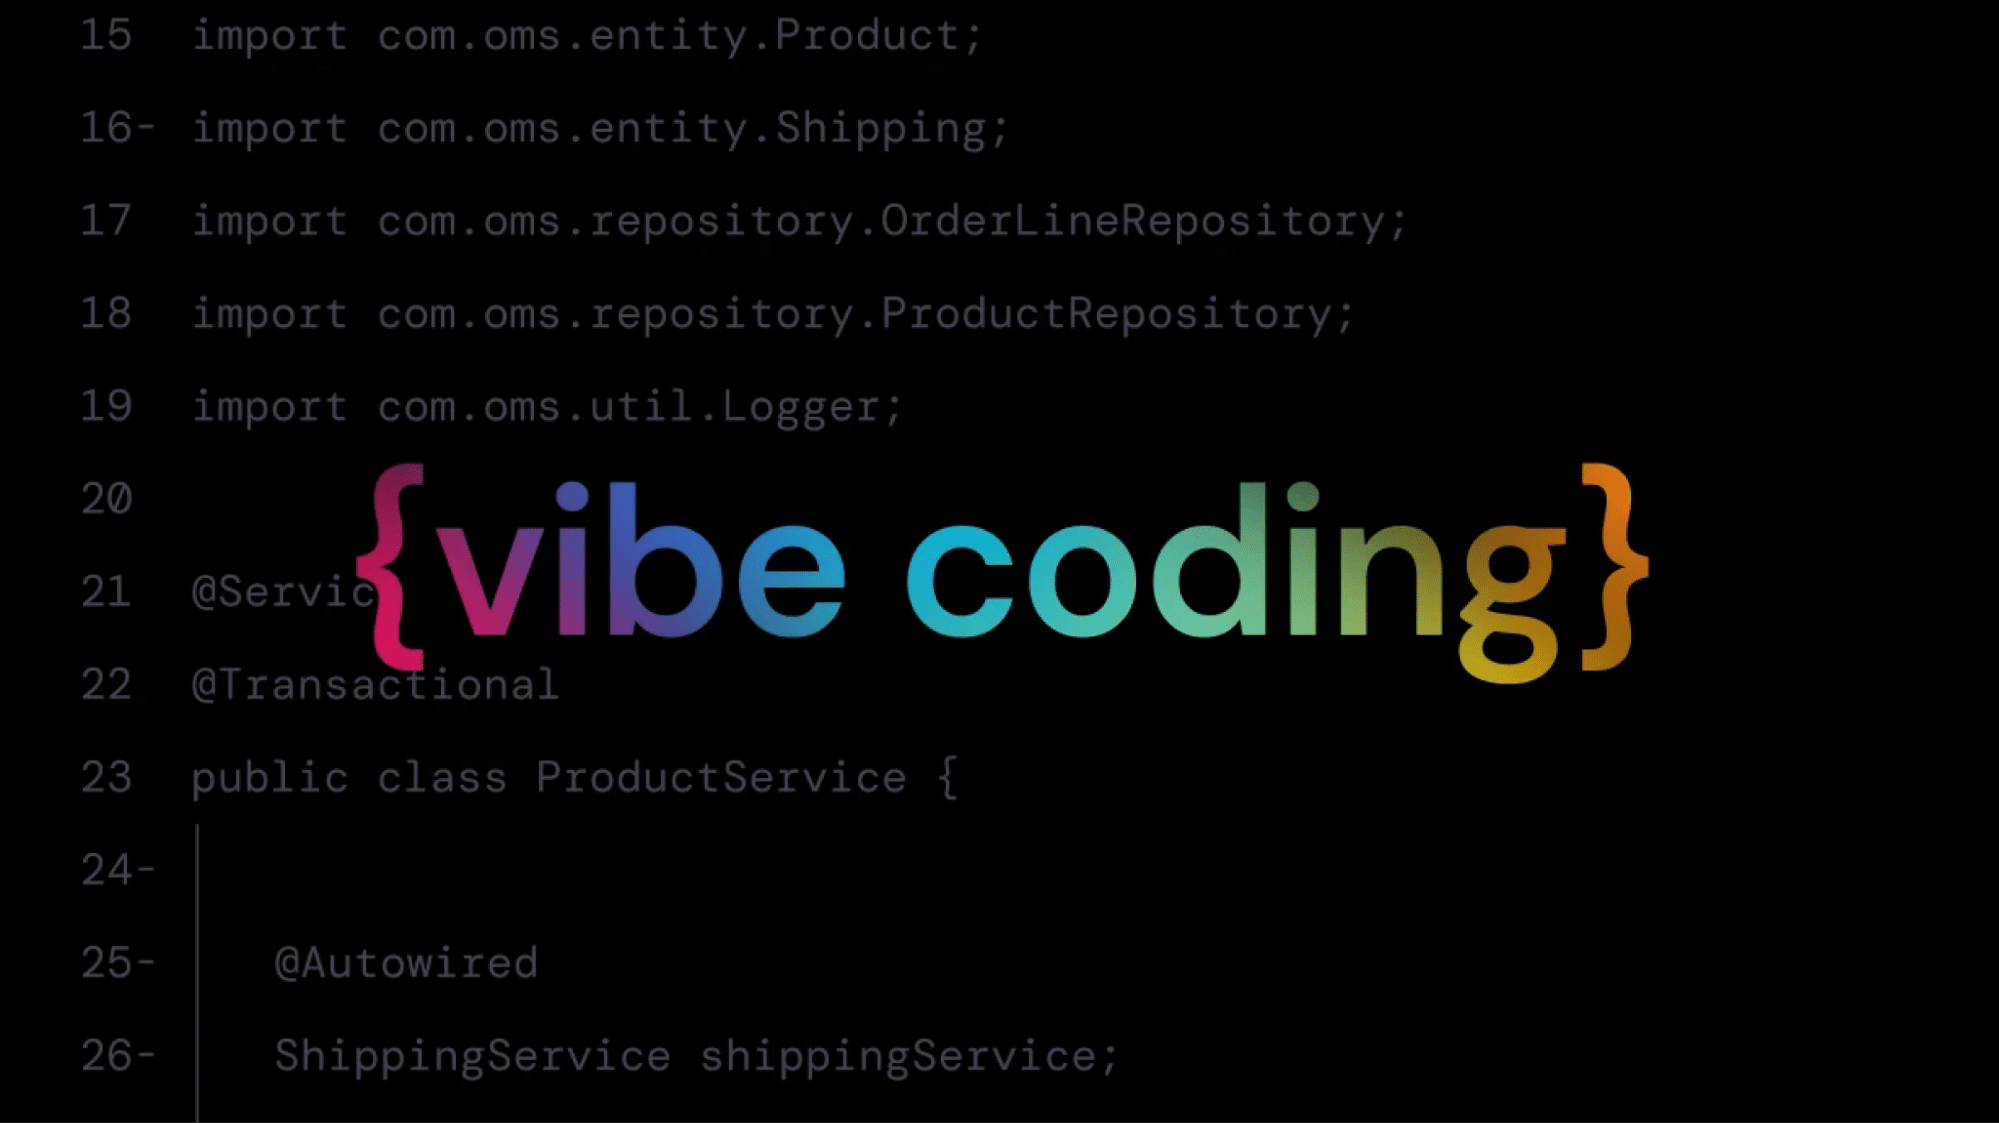
Fast forward less than two years, and the developer experience is undergoing another radical transformation built upon this initial wave. Instead of having AI make partial suggestions to help us build functions and small pieces of the application, one suggestion at a time, now, it’s possible for agents to write almost every line of code and make every decision around the framework in which the app is built. Although it comes in many different flavors, one that stands out is “vibe coding.” It’s essentially agentic coding taken to the extreme, where the agent works to create an application with minimal human intervention. Most of the human interaction occurs when repeatedly pressing the Tab key or instructing the agent to proceed.
Whether using vibe coding or cautiously guiding agents to generate or refactor large fragments of a codebase, the developer’s workflow has undergone significant changes. Instead of manually writing boilerplate, scaffolding architectures, or even debating framework choices, developers can let the coding agent make these choices. Tools like Replit, Lovable, and GitHub Copilot’s agentic mode make it easier to go from idea to code.
Butare these AI agents actually building good software?
More specifically, are these generated applications:
Scalable and maintainable for enterprise applications?
Following best practices for code and architecture?
Able to be guided towards better architectural outcomes?
These questions become more complex when we consider that most enterprise development isn’t building new applications from scratch; it’s working with existing codebases that may be years or decades old. While much of the excitement and trends around AI coding focus on greenfield projects and newly built applications, the reality is that most developers spend their time maintaining, extending, and modernizing legacy systems.
The answers to these questions will likely determine the longevity of this trend and the apps that emerge from it. In this blog, we’ll explore how AI agents implicitly make architecture decisions and the risks that come with it. We’ll demonstrate how developers and architects can craft more effective prompts that integrate architectural thinking into agent workflows. We’ll touch on another rapidly emerging adjacent trend — vibe speccing. And finally, we’ll examine how tools like vFunction can validate, guide, and enhance agent-generated code by leveraging real-world architectural insights. Let’s start by exploring how AI agents are making decisions regarding application architecture.
How do AI agents make architectural decisions?
Computers are much faster at making decisions than humans in many situations, but when it comes to designing an application, there are many decisions to be made. Generally, before developers start coding, they’ve already thought about many high-level questions.
Which frameworks to use?
How to organize files and folders?
How to handle state, caching, or error boundaries?
Where to define business logic?
How to structure the data flow and external dependencies?
These same questions are also “considered” by the agent, and the answers are provided much quicker than humans. This means AI agents don’t just generate code; they generate architecture by default.
Even if the prompt doesn’t include explicit architectural instructions, the agent still makes architectural decisions and implements them as part of code generation. These architectural decisions are baked into the codebase, and they can have significant implications for scalability, maintainability, and performance.
Implicit vs. explicit architecture
AI agents, especially general-purpose LLMs, make decisions based on patterns in training data. An agent is only as good as the data it is trained on, and many agents follow a self-learning cycle, which means they improve over time with the feedback they receive. Because the agent’s logic is shaped by feedback, if it is poor, then the outcomes will also be poor. For the architecture of a generated application, this means an agent may:
Adopt patterns that were popular but are now considered outdated
Favor simplicity or familiarity over best practices or modularity
Skip important layers of abstraction (e.g., services, repositories, data transfer objects) unless specifically instructed.
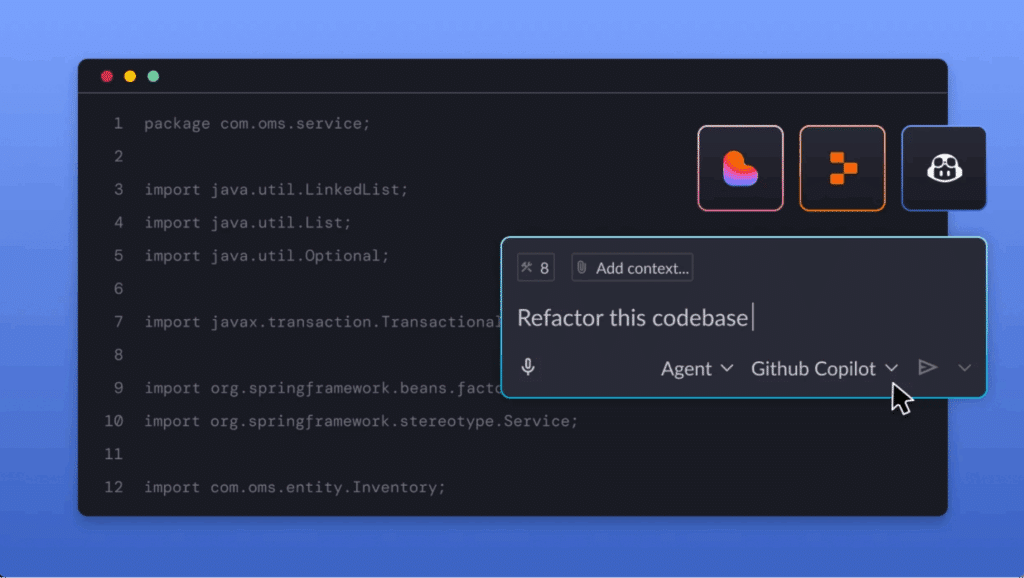
To fully understand the good and bad of agents, you need to use them. Here’s an example of what a coding agent may do when given a simple prompt without much direction around the architecture. Let’s assume you feed the following prompt to the agent:
“Build a REST API in Node.js that allows users to create and view blog posts.”
From this prompt, the agent might generate something like this:
A single server.js file
Inline route handlers
MongoDB connection hardcoded into the route logic
No service layer, input validation, or test coverage
Most likely, this app will function as intended. If you don’t look under the hood, everything might seem fine until you hit the limits of this simplistic design later, when you expand on features or scale the app. The architectural implications of this implementation mean the application:
Has no separation of concerns
Is hard to scale or test
Contains tightly coupled logic that makes refactoring painful
Has no domain boundaries or layered architecture
Although the application works, you’re almost guaranteed to bang up against the wall quickly. You’re essentially baking technical debt into the application from the start.
Why this matters
If you’re experimenting with AI-driven coding, chances are your agents are making quiet decisions that set your project on a fixed trajectory. Once the base code is generated, with various patterns already intertwined into it, decisions that have a major impact have been made even before you write a single line yourself. This becomes a bigger issue as the app grows or gets handed off to other teams. This challenge is further amplified when working with existing codebases, where agents working with the existing application must navigate not only architectural decisions but also legacy constraints, existing integrations, and business logic that may not be immediately apparent from the code structure alone and may require additional context to make accurate changes.
When it comes to modern software architecture, it is generally a best practice to focus on specific elements from the design phase through to implementation. Key points usually include:
Loose coupling and high cohesion
Resilience and fault tolerance
Modularity and testability
Observability and performance under load
These concerns, if not addressed through initial and subsequent prompts when using the agent to create the application, might be overlooked. This makes sense since the agent, by default, is looking to create something that works, rather than adhering to the principles of systemic design.
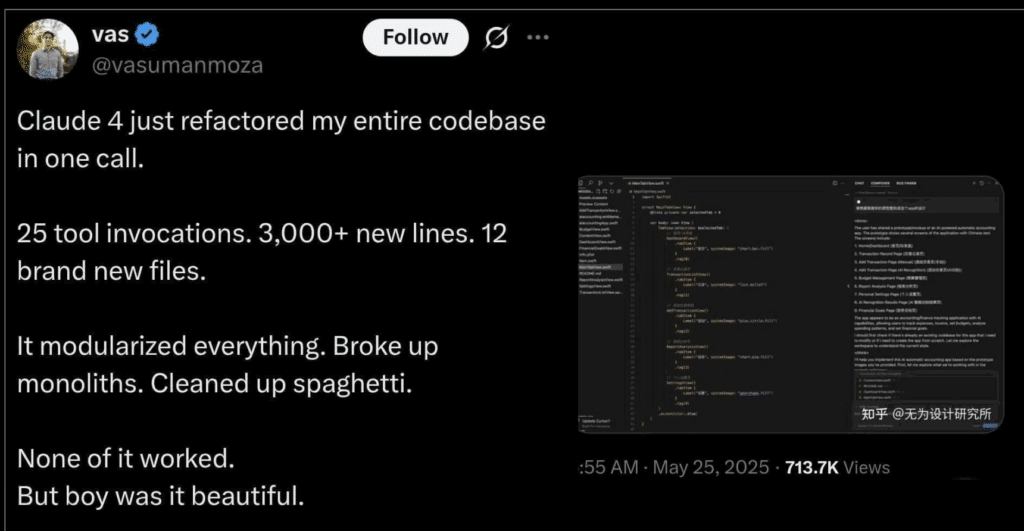
Vibe coding falls short when an agent is fed unrefined prompts.
Can AI agents build scalable, resilient systems for the enterprise?
At first glance, AI-generated applications look impressive. Within seconds, potentially minutes for larger apps, a working application is spun up and ready to go. The syntax is (generally) clean. The app works. The API responds as expected. However, beneath the surface, there is often a lack of architectural rigor. Experienced developers and architects can peek under the hood and prompt the agent to make changes for the better. But what about less experienced developers or those with no technical background using these systems to build mission-critical applications? And what happens when these same agents are turned loose on complex, business-critical enterprise systems with years of accumulated logic and technical debt? Without making sure the application’s code is architecturally sound, brittle and hard-to-scale systems can develop over time.
Much of this may not matter for the typical vibe-coded application with just a few users. But are vibe and agent-led coding techniques ready for the enterprise? It all comes down to the architecture they generate and their ability to align with proven best practices. Vibe coding has begun to permeate the enterprise, where flaws related to scale and security (among other factors) are more detrimental and may not be easily identified. Whether written by a developer or an agent, code is only as good as the architectural foundation it’s built on.
So are AI agents building scalable and resilient systems? Let’s break this down across three key architectural qualities: scalability, resilience, and best practices.
Scalability: Will it grow with you?
Application scalability isn’t about how fast the code runs on your laptop — it’s about how well the app handles increased users, traffic, and complexity. When AI agents create code, there are a few common shortcomings, including:
No separation between compute and storage
Missing pagination or rate limiting on API endpoints
Business logic is tightly coupled with facade layers
Synchronous request handling that blocks under load
Infusing these anti-patterns into an application may be acceptable for a toy app or a quick proof-of-concept, but applications with any level of usage will likely struggle under load. Unlike well-architected applications, agents rarely incorporate strategies such as asynchronous processing, caching layers, or horizontal scaling considerations.
Resilience: Can it recover gracefully?
Application resiliency goes beyond having an app that works. With resilient systems, when things break, they recover. Unless very specifically prompted, most AI-generated code doesn’t account for:
Transient network failures
Rate-limited external APIs
Unexpected database outages
Most agents write code that overlooks components that would be included in many production-ready applications. If a developer created the application, they would likely include features such as retry logic, circuit breakers, graceful fallbacks, timeouts, and structured error propagation. With the AI-generated code, you’ll usually get a happy-path implementation that assumes every service is always up and every request succeeds. There’s nothing wrong with this in the prototyping stages; it’s even fine for a demo. However, it’s a risk in anything that’s expected to run in production.
Best practices: Is it built to last?
Even when an AI-generated app “works,” it might not age well. It’s not to say that every application built directly by a developer is perfect either, but with pull requests and best practices being scanned for by the team as the application develops, major issues are less likely to fall through the cracks.
Things that senior developers and architects look for in a well-architected app are often overlooked by agents. These include:
Clear domain boundaries (domain-driven design, modular monoliths, or microservices)
Test coverage (especially integration and contract tests)
Here’s a comparison of well-known best practices and the typical output from agents building applications:
Aspect
Typical Agent Output
Best Practice
File structure
Flat or minimal
Modular with clear boundaries
Error handling
Try/catch or nothing
Centralized with typed error responses
Input validation
Often skipped
Required for every field
Business logic location
In route handlers
In services or domain layers
Observability
Console logs
Structured logs + tracing
It’s nothing against AI agents. They are great at building code that runs, but they don’t inherently build systems that last. Without guardrails and solid prompting skills (driven by an engineer/architect’s expert skills and experience), agents tend to overfit to short-term utility rather than long-term architecture and sustainability.
If you want to move fast and build well, AI agents are definitely part of the equation. Of all the above points, the answer is clear: you need to guide the agent with architectural intent and inspect the results critically. One of the best ways to do this is to work with the agent on a plan before implementation. Some newer platforms and models, such as vibe speccing, are already doing this, outlining an implementation plan and key details to the developer before the agent flies off and does its thing. Creating a specification for the software piece before beginning an infinite loop of code generation cycles can be more effective for agents and lead to a cleaner, initially generated codebase. This optimized flow is akin to what you’d do if you were working on this code with a team of humans, ensuring that the generated application meets the standards you’d hold developers and architects to if they built it by hand.
Vibe coding with existing and legacy codebases: the enterprise reality
While the promise of vibe coding is exciting, compared to starting a net-new application, the reality in most enterprise environments is far more complex. The majority of enterprise development isn’t greenfield work on shiny new projects but instead revolves around working with existing codebases that are five, ten, or even 20 years old. Within these systems are layers of technical debt, undocumented business logic, and complex interdependencies that make agent-driven development significantly more challenging to do well.
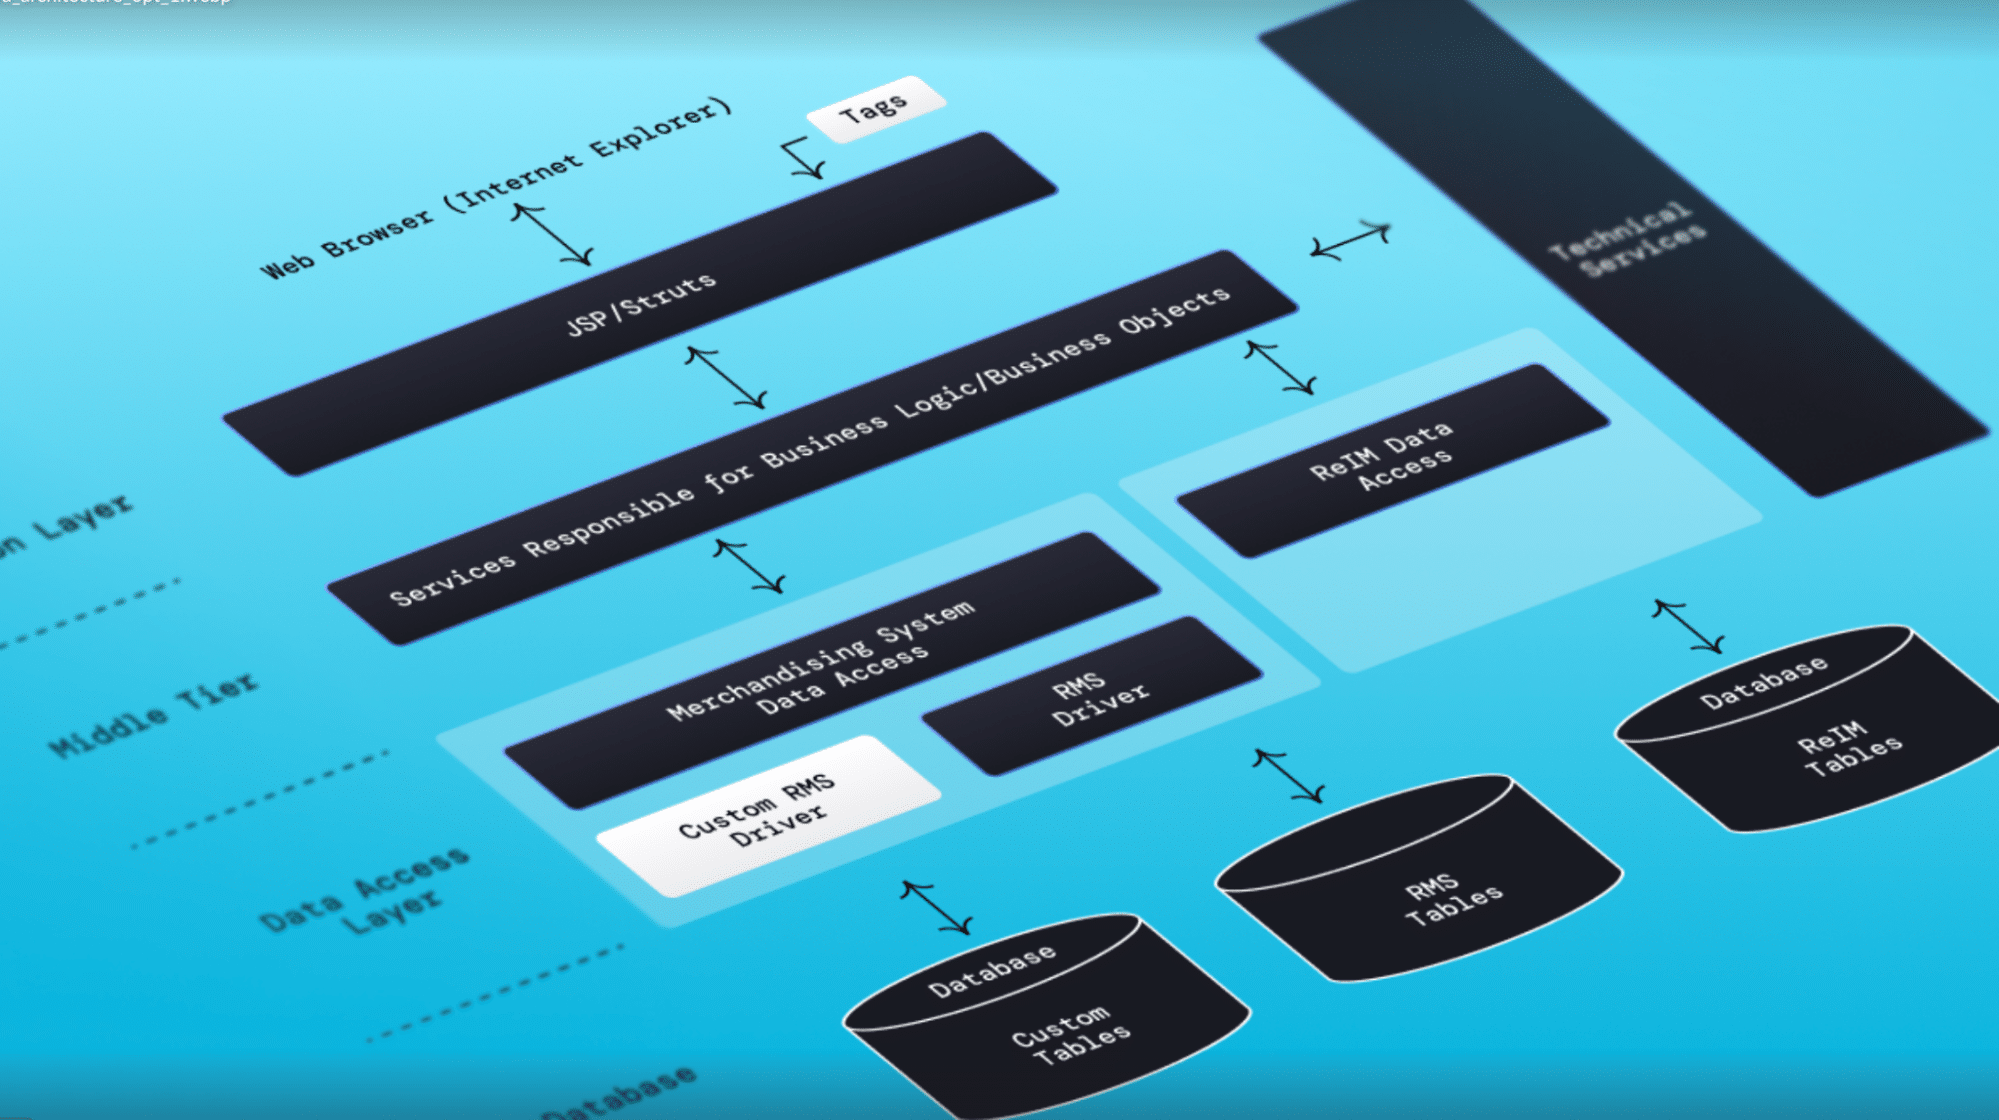
Tangled, monolithic application underscores complexity of legacy codebases.
Unlike greenfield scenarios, where agents can make architectural decisions from a blank slate, working with existing codebases requires understanding existing systems before making changes. This creates a fundamentally different risk profile that most discussions around AI coding agents don’t adequately address, but will become a top priority as these tools infiltrate the enterprise.
The legacy code challenge
Legacy systems present unique obstacles that agents aren’t naturally equipped to handle. Years of quick fixes and workarounds may appear as “bad code” to an agent, but they serve critical functions. Business rules are embedded in code without clear documentation. Systems have grown organically with tight coupling between components that isn’t immediately obvious. Architectural decisions that made sense at the time may appear outdated without understanding the original constraints and context that extend beyond the code itself. It’s not that agents won’t attempt to make changes; they will. The problem is that the change may not be in the overall best interest of the system.
Unique risks with existing codebases
When agents work with existing codebases, several specific risks emerge. Agents may not understand why certain “bad” patterns exist. Again, what appears to be poor architecture might actually be a workaround for deeper issues encountered many years before or integration constraints that the agent can’t see. They might optimize a database query in one service without realizing it breaks a process within another service. Or they might “clean up” what appears to be redundant validation logic, not realizing it handles edge cases that only occur with specific legacy data. To add insult to injury, many of these legacy codebases have poor code coverage on the unit and regression testing sides, which means that changes made may not be able to be validated for overall compatibility.
The promise vs. reality
The promise of using AI agents with existing codebases is seductive: “Just point the agent at this legacy code and modernize it.” The reality is far more nuanced. Without proper architectural context, agents often make changes that may work locally or in the scope of a single service but break the system globally.
This is the fundamental challenge of using AI agents with existing codebases: agents excel at local optimization but struggle with understanding the system’s overall architecture. They can improve code in isolation, but this may make the overall system worse.
Prompting for better architecture: Tips & examples
Many of us have used ChatGPT and similar models over the last few years to answer our questions. The result we get is generally a direct result of the prompt used. For general questions, this is usually alright, although hallucinations are still present, but when you’re using the output of agents and their underlying LLMs to create critical infrastructure, it’s a bigger issue. So, it goes without saying that most architectural flaws in AI-generated code don’t come from the model being “wrong;” they come from vague prompts.
If you ask an AI agent to “build an app,” it will do just that: build an app. However, it won’t necessarily build one that is testable, modular, observable, or future-proof unless you explicitly request those qualities.
The good news? You can prompt your way to better architecture. Let’s look at how this can be done for a greenfield app you’re building.
Tip #1: Be specific about layers and responsibilities
Agents tend to collapse everything into route handlers unless told otherwise. Prevent this by breaking out the expected architecture. This requires expanding the prompt to steer it with explicit commands on how you want the application to be structured. For example, here is a poor prompt that would leave a lot of decisions up to the agent to arbitrarily make:
Build a REST API in Flask to manage tasks.
To enhance this prompt, we can then add a few more pieces based on how we want the specific application to be built (which in this case is a Flask app). Here is an example of the improved prompt:
Build a Flask API to manage tasks, using a layered architecture with:
•a controller for routing,
•a service layer for business logic,
•and a repository layer for data access using SQLAlchemy.
By prompting like this, the agent should structure the code into separate modules and layers. This will more closely align the output with the architecture and structure that you would want to see if you were coding this by hand.
Tip #2: Mention non-functional requirements
Building on this initial prompt, we can also incorporate non-functional requirements related to observability, security, and resilience. Generally, if not explicitly asked for, these won’t magically appear in the AI output. It’s best to be explicit and assume that these implementation details don’t appear unless you ask. Here’s an example of some further prompting we could add to the previous prompt:
Add basic logging using the logging module, input validation for all endpoints using Pydantic, and retry logic for database operations.
Even better, we can add in more explicit instructions on what to expect and how the application should handle it to the prompt, like so:
The API should log each request, track execution time, and return a structured JSON error if something fails.
This will further improve the structure and functionality of our application. Again, prompting in an extremely explicit way is the best way to ensure that the app is built according to requirements. What the agent doesn’t know, it will fill in the blanks for, and not always in a good way.
Tip #3: Think like a system designer, not a feature dev
Lastly, when you prompt, don’t just describe features; describe the architectural goals of the system. Agents are quite adept at understanding design principles, but they are not always effective at incorporating them into the generated code from the outset. Once again, going extremely explicit is the way to be. The beauty of modern agents and LLMs is that the context windows are massive, so you can add an extensive list of specifications and design instructions without the worry of overwhelming the underlying LLM. To build further on the previous prompt, let’s examine additional text to incorporate into the prompt that ensures the application output aligns with our true needs and design requirements. For example, we could add this to the above prompt:
Build a modular task management API that can scale horizontally and supports future transition to a microservice architecture. Prioritize:
Clear separation of concerns
Statelessness
Dependency injection, where appropriate
Key takeaways for prompting with architecture in mind
Prompts are the new architecture documents. By prompting with structure, constraints, and intent, you can get significantly better agent output. Combine this with architecture-aware tools (like vFunction, which we’ll cover next), and you can shift AI from just generating code to creating sound, scalable systems for new and existing complex systems in a fraction of the time it takes to hand-code such applications.
The best approach to prompting is to scaffold your system incrementally, rather than using a single massive prompt. Similar to building an app from scratch, use the agent to build a base application you are happy with, then add enhancements through targeted iterations. And never be afraid to be overly specific. The agent knows a lot more than any human developer could possibly know. This means that you can easily feed a prompt to the agent like this:
“Create a modular [app type] using a layered architecture: controllers, services, repositories. Use [framework] and [ORM].”
“Ensure the API has structured logging, input validation, and retry logic for all external calls.”
“Design the system to support horizontal scaling, with stateless services and no shared session state.”
And see results that should align very closely with the expected output. Of course, iterating on an application with AI while ensuring that the architecture is aligned is a significant task. Luckily, vFunction provides a platform that can be integrated into these flows to ensure everything is architecturally sound, eliminating the need for time-intensive manual audits. Let’s look at how vFunction fits into the workflow next!
Using vFunction to ground agent output in real architecture
While AI agents can quickly generate large volumes of code, evaluating the architectural quality of that code, especially in existing applications, remains a major challenge. That’s where tools like vFunction come in. Beyond architectural observability, vFunction actively guides and validates modernization efforts by providing the architectural context that agents lack. This is especially critical in legacy systems, where understanding what the code does is only part of the picture.
Agents also need to understand how that code fits and works in the broader architecture, something vFunction’s deep static and dynamic analysis delivers, enabling more informed and reliable modernization decisions.
What vFunction does
vFunction combines static and dynamic analysis with data science to uncover architectural technical debt, provides relevant context to code assistants for automated refactoring, and breaks monoliths into scalable, cloud-ready services for faster service transformation.
As part of this process, vFunction analyzes your application and identifies critical architectural issues, including:
Domain boundaries and entanglement
Dead code and god classes
Technical debt hotspots and anti-patterns
Metrics like modularity and complexity
vFunction combines static and dynamic analysis with data science to uncover and fix architectural technical debt.
Essentially, it provides a baseline architecture, based on the static and dynamic analysis of your app’s current structure, and identifies areas for improvement. When working with existing codebases, vFunction goes beyond surface-level code analysis. It understands the actual runtime behavior of your application, including how different components interact, which code paths are actually used, and where the real architectural boundaries exist, as opposed to what the code structure suggests. This dynamic understanding is crucial when guiding agents to make changes to existing systems.
Pairing AI agents with vFunction’s insights
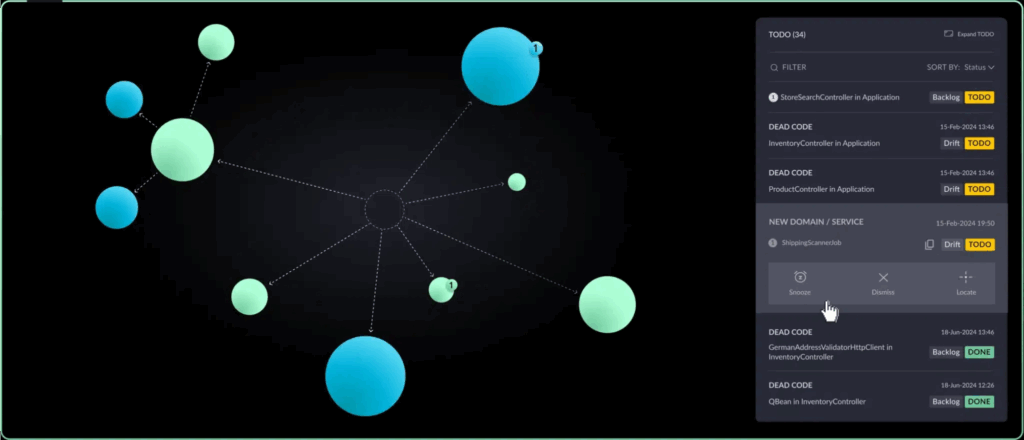
Once you have a baseline, you can use that information to feed context into your agent and guide its next steps. These insights are turned into specific, structured TODOs (tasks), each paired with a refined GenAI prompt optimized for code assistants like Amazon Q. Rather than relying on guesswork, you can now instruct agents with architectural context. This transforms the agent from a raw code generator into an architecture-aware co-pilot.
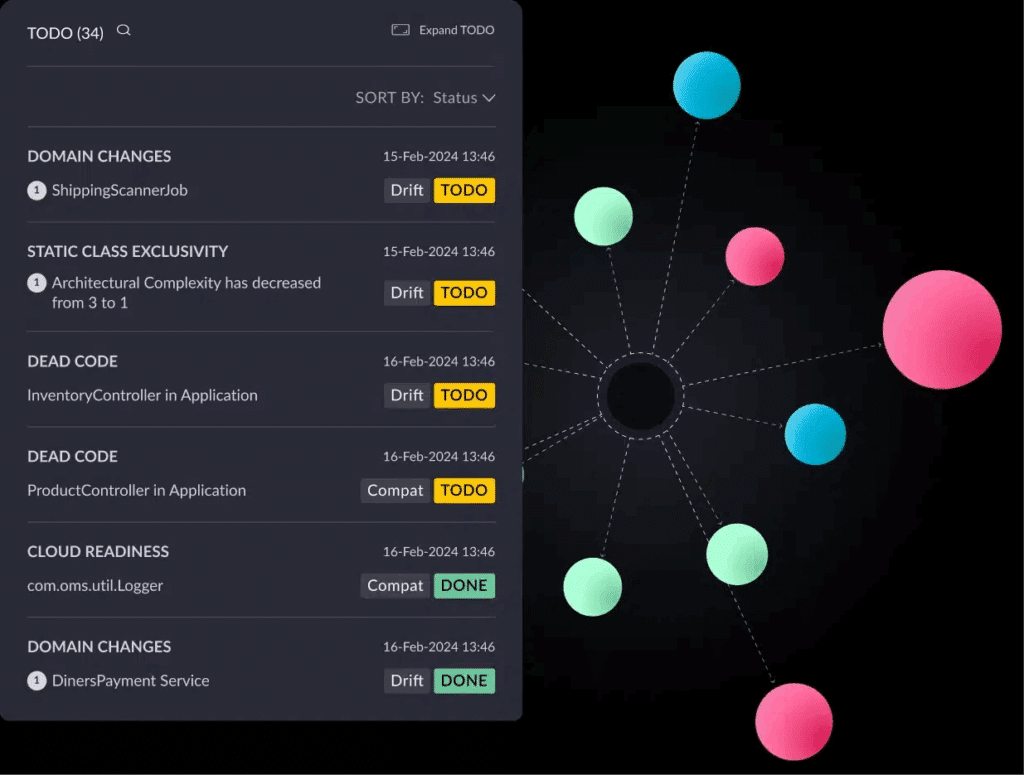
vFunction’s architectural insights are turned into specific, structured TODOs (tasks), each paired with a refined GenAI prompt optimized for code assistants.
For legacy systems, this process is particularly powerful because vFunction can identify which parts of the system are safe to modify and which require extreme caution. It can detect dead code that can be safely removed, identify god classes that should be split, and highlight areas where refactoring will have the most impact on architectural quality.Here is a high-level example workflow of how this would work:
Run vFunction on your existing monolith.
This will allow vFunction to understand the underlying architecture and dependencies. With this understanding, vFunction will generate TODOs and corresponding prompts that will help the agent refactor the application towards the target state.
Feed this into your AI prompt:
Based on the most pressing TODOs, you’ll select a prompt and inform the agent of the changes you’d like it to implement. For example, here is a prompt that vFunction might generate to improve dynamic class exclusivity:
“We want to split the class com.oms.service.InventoryService into two variants, which we’ll refer to as local and global. The local variant should be used in the execution paths below, and the global one in all other cases. In order to minimise code duplication, the local variant can inherit from the global variant. The execution paths are:
Have the agent implement changes based on vFunction’s guidance.
Re-run vFunction to compare the new state to the original baseline.
Are modularity scores improving?
Is the dependency graph simpler?
Has domain entanglement decreased?
Ensuring agent-generated changes align with architectural goals is critical—especially in large, complex codebases where multiple iterations may be needed to get it right. A strong feedback loop helps ensure those changes enhance architectural quality rather than introduce new issues. vFunction supports this by detecting when agent changes add coupling or violate architectural boundaries, providing immediate feedback to guide the next iteration.
AI + architecture: Augmentation, not automation
AI agents aren’t ready to replace senior architects and engineers, but they can augment their workflow when paired with strong tools like vFunction. By providing architectural observability with data science and GenAI and grounding agent actions in real data, you shift from vibe coding to intentional, architecture-first development. This is the future of production-ready agent-based application development.
Conclusion
We’re entering a new era of software development, one where AI agents write more and more of the code, but humans still hold the architectural vision. With the right prompting strategies and the right tools to measure what matters, you can build faster without sacrificing structure.
Whether you’re modernizing a monolith or starting a new app from scratch, the combination of AI and architecture tooling like vFunction gives you a scalable path forward consisting of one prompt, one refactor, and one architectural improvement at a time.
Want to see how vFunction brings architectural intelligence to AI-driven development? Get in touch—we’d love to show you how it works inside modern developer environments and help you bring structure to speed.
What if you could talk to your app’s architecture the way you talk to your favorite LLM? “Show me the top 5 classes by CPU usage in domain A,” “Find all classes from package B that sneak into other domains.” That’s exactly what we’ve built: a query engine that lets you ask your monolith questions—no custom scripts, no guesswork.
vFunction’s new GenAI-powered query engine lets architects and developers run natural language prompts against the structure of their monolithic application. Just ask a question, and we’ll handle the rest: translating it to safe, validated internal queries, running it against our database, and returning results in a readable table. All you need to do is type.
Why build a query engine?
Monoliths are famously opaque, and do you really want to spend the precious hours in your day trying to decode them? Understanding how the system behaves, what calls what, where coupling occurs, and how methods evolve is often buried under layers of code.
Customers asked us, “Can we export what we see in the call tree?” They wanted to include it in architecture reviews, technical documentation and diagrams. Screenshots weren’t cutting it. That’s when we realized the architectural graph powering vFunction should be queryable with natural language. That got us thinking—what else could we do?
Here are some examples of queries users can run that would previously require exporting and manually filtering a full call graph:
Show me all classes used in more than four domains that aren’t common. → Reveals architectural coupling or candidates for shared libraries.
Find all methods in the call tree under the domain ProductController that use beans. → Useful for mapping data access patterns, often buried in complex trees.
Which domain shares the most static classes with the domain InventoryService? → Helps determine which domains could be merged with the current domain.
How does the query engine work?
The query engine is not just a search box. It’s a full-blown architectural Q&A powered by GenAI, tied into your application’s live architectural state.
Here’s how it works:
You write a prompt like “Show me the classes using the SalesOrderRepository across domains.”
Our GenAI turns the prompt into a query.
We send only the query to the GenAI provider—no data, no context, just the natural language prompt.
The GenAI returns a query.
We run the query locally against your vFunction server’s architecture data and display the results in a table or CSV format.
Security first
LLMs can hallucinate. We don’t let them.
vFunction never sends your application data to the GenAI provider. Only the user’s natural language prompt is shared. Nothing else. The GenAI is used strictly to translate the prompt into a query tailored for vFunction’s internal schema. At no point is your measurement data exposed outside your environment.
After generating the query, vFunction validates and sanitizes it, then runs it locally on your server. You get the benefits of natural language interfaces with complete data privacy and protection.
The result: conversational architecture analysis
With the new GenAI-powered query engine, you don’t need to dig through call trees or guess how classes relate. Just ask.
Want to explore stack traces, track class reuse across domains or filter down a call path for documentation? Open vFunction’s query engine, describe what you’re looking for, and get the answer. Even the most complex monolith is now an open book—saving you hours of effort digging through code, tracing dependencies, and assembling documentation.
Curious how vFunction helps teams tackle technical debt and turn monoliths into modular, cloud-ready apps? Explore the platform and see what architectural modernization looks like in action.
The rise of AI-driven code development is fundamentally reshaping the demands on software architecture. As AI accelerates the creation of new features, services, and applications, it also expedites application complexity, often without a system-wide view. Without strong architectural oversight, AI-generated code can lead to service duplication, unwanted dependencies, and microservices sprawl.
Architecture has a critical role to play in keeping systems resilient, scalable, and secure as they evolve. But today, architecture is often poorly documented, disconnected from day-to-day development, and left to drift. That gap isn’t just a technical problem, it’s a business risk, leading to project delays, security vulnerabilities, and performance challenges that organizations can’t afford to ignore.
That’s why we conducted a new research study with over 600 senior technology leaders, including architects, engineering leaders, and CTOs across the U.S. and U.K. To understand where architecture stands today, and where it must evolve to meet the demands of the AI era, we surveyed experts from organizations ranging from $100M in revenue to enterprises exceeding $10B.
Critical disconnect
Survey results expose a critical disconnect between architectural intent and implementation reality.
The findings are striking
93% of organizations report negative business outcomes tied to architectural misalignment.
Approximately 50% cite misalignment as a cause of project delays, security and compliance risks, and unexpected operational costs.
Only 43% say their architecture documentation fully reflects production reality.
90% agree that architectural insights should be integrated into observability tools to address application issues before they become outages.
While architecture is recognized as essential, many organizations still struggle to keep it aligned with fast-changing production environments. Smaller companies ($100M–$999M) maintain better alignment compared to enterprises above $1B, suggesting that architectural control decreases as organizations and complexity scale.
Why acting now matters
AI isn’t slowing down and neither is the pressure to deliver faster, more complex systems. Waiting to integrate architectural practices risks locking in technical debt and instability that become harder to unravel later. Without action, organizations risk scaling complexity instead of innovation.
This report explores how new technologies like OpenTelemetry, AI and architectural observability are reshaping how we build and govern modern systems—and why organizations must rethink architecture not just as a design artifact, but as a continuously manageable process embedded in the SDLC and security practices of the organization supported by real time observability tools .
I invite you to dive into the full research report to see where the gaps are, why they matter, and how organizations can close them.
Java, introduced by Sun Microsystems in 1995, remains a dominant programming language in the tech industry. Its enduring popularity is attributed to the robust architectural framework that facilitates the development of scalable and maintainable enterprise applications. The core components of Java’s architecture – JVM, JRE, and JDK – establish a foundation for platform independence, while application architecture patterns and design principles enhance Java’s effectiveness in enterprise settings.
Modern enterprise Java applications have evolved to incorporate distributed systems, microservices, and cloud-native architectures, replacing traditional monolithic structures with more intricate designs. The shift towards complexity requires a comprehensive understanding of both the foundational Java platform architecture and the evolving application architecture for successful modernization, refactoring, and new development projects.
In this blog series, we delve into Java architecture at both the platform and application levels, exploring key concepts of this object-oriented programming language and its architecture. By examining the high-level principles within Java architecture, readers will gain valuable insights for navigating the complexities of modern enterprise software development.
What is Java architecture?
The architecture of a Java application can encompass both the underlying Java platform components that execute Java code and the higher-level application design patterns used to structure Java applications. Understanding these two facets of Java architecture helps to explain the unique advantages Java brings to enterprise software development.
Platform architecture
At its core, Java’s platform architecture consists of several interconnected components that enable its “Write Once, Run Anywhere” (WORA) philosophy:
Java Virtual Machine (JVM): The runtime engine that executes Java bytecode, providing platform independence and memory management
Java Runtime Environment (JRE): Contains the JVM and standard libraries needed to run Java applications
Java Development Kit (JDK): Includes development tools along with the JRE for creating Java applications
Using this platform architecture allows applications built with Java to have a clean separation between the application itself and the underlying hardware/operating system. Because of this, Java was one of the first languages and platforms to enable scalable cross-platform compatibility, allowing apps to run anywhere while being performant and secure.
Application architecture
Building on the foundation of the underlying platform architecture, Java application architecture refers to the organization of components, classes, and modules within Java applications. Although Java applications can use a wide variety of software design patterns, common Java application architecture patterns include:
Layered architecture: Organizing code into horizontal layers (presentation, business logic, data access)
Model-View-Controller (MVC): Separating application concerns into data models, user interface views, and controller logic
Microservices architecture: Decomposing applications into loosely coupled, independently deployable services
Event-driven architecture: Building systems around the production, detection, and consumption of events
Domain-Driven Design (DDD): Structuring code to reflect the business domain
Java’s unparalleled flexibility has solidified its position as the preferred language for enterprise applications. Numerous Java frameworks facilitate the implementation of best practices derived from common design patterns. In upcoming discussions, we will delve deeper into how Java embeds structure and efficiency into the development process.
Architectural principles in Java
Regardless of the specific software design pattern chosen, several core architectural principles guide Java application design. Developers generally adhere to well-established best practices, such as:
Modularity: Breaking down applications into cohesive, loosely coupled modules
Separation of concerns: Isolating distinct aspects of the application
Dependency injection: Providing dependencies externally rather than creating them internally
Interface-based programming: Programming to interfaces rather than implementations
Testability: Designing components that can be easily tested in isolation
These principles combined with Java’s platform architecture are Java’s secret recipe (or maybe not so secret!) for building and deploying enterprise software applications that are maintainable, extensible, and scalable.
Java architecture components
As discussed, Java architecture can be understood at two levels: the platform components that execute Java code and the application components that structure Java applications. Within these two levels, various components exist that create the overall architecture. Let’s take a deeper look at each of these components.
Platform architecture components
Although many subcomponents exist within the Java platform, they can generally be grouped under three high-level categories we touched on earlier: the JDK, JRE, and JVM.
Java Development Kit (JDK)
The JDK provides the tools needed for developing Java applications, including:
Java Compiler (javac): Converts Java source code into bytecode
Development tools: Including javadoc (documentation generator), jar (archiving tool), and debugging tools
Java Runtime Environment (JRE): For executing Java applications
Java Runtime Environment (JRE)
The JRE provides the runtime environment for executing Java applications, including:
Java Virtual Machine (JVM): The execution engine
Java class libraries: Standard libraries for common functionality
Integration libraries: For database connectivity, XML processing, etc.
Java Virtual Machine (JVM)
The JVM, the cornerstone that makes Java platform independent, includes:
Class loader subsystem: Loads, links, and initializes Java classes
Runtime data areas: Memory areas for execution (heap, stack, method area)
Execution engine: Interprets and compiles bytecode to machine code
Garbage collector: Automatically manages memory
It also supports the Java Native Interface (JNI), which allows Java code to interact with native applications and libraries written in other programming languages like C or C++. These integrations are often achieved using native methods, which are declared in Java but implemented in non-Java code via JNI. To make it a bit easier to comprehend, Oracle created this great visual breakdown of how each component and subcomponent exists within the platform.
While platform-level architecture is crucial for understanding Java’s framework components, the application architecture is paramount when it comes to scalability. Developers and architects wield direct control at this level, making it essential to grasp for creating scalable Java applications.
Application architecture components
Modern Java applications typically consist of a layered approach to architectural components. Although this may vary slightly depending on the framework used or the design patterns being implemented, many use these paradigms as the building blocks. Looking at the image below, you can see how these layers tend to interact with each other.
Digging in a bit further, you’ll see three distinct layers that developers have direct control over: the presentation, business, and data-access layers.
Presentation layer
This layer handles user interaction and generally consists of:
Controllers: Process user input and coordinate responses
Views/UI components: Display information to users
Data transfer objects (DTOs): Carry data between layers
Business layer
This layer contains the core business logic of the application, consisting of:
Service classes: Implement business operations and workflows
Domain objects: Represent business entities and their behavior
Business rules: Encapsulate company policies and regulations
Data access layer
Lastly, at the lowest level in our hierarchy, the data access layer manages data persistence and retrieval, including:
Repositories: Provide methods for database operations
Data access objects (DAOs): Encapsulate data access logic
Object-relational mapping (ORM): Maps between objects and relational databases
Cross-cutting concerns
Of course, shared between these layers are various cross-cutting concerns that need to be thought of holistically. Within the code and overall application architecture, aspects that span multiple layers include:
Security: Make sure that authentication, authorization, and encryption are handled and applied where needed through these layers. Generally, these mechanisms are applied at multiple or all layers throughout the application.
Logging: Ensure that all application activities and decisions are logged for easier debugging and auditability.
Error handling: The application should effectively manage and report exceptions, in conjunction with the previously mentioned point on logging.
Transaction management: Data consistency is dependent on how transactions are handled throughout the application. Although most critical at the data-access layer, the other layers must also make sure that data is synchronized to minimize any risk of discrepancy.
Caching: Each layer may benefit from improved performance by storing frequently used data within a cache. This can help with API requests, database response times, and many other areas where having caching in place can make the application more performant.
Java execution process
Having discussed the architectural components, it is now crucial to understand the execution process of building and running Java applications. Understanding the Java execution process is essential for optimizing application performance and troubleshooting issues. Because there are multiple steps involved, things can get a little confusing at times for the uninitiated. At a high level we will break it into compilation, loading, and execution.
Compilation process
The Java compilation process converts human-readable source code written by developers into machine-executable instructions. Overall, this consists of three steps:
Compilation: The javac compiler converts source code to bytecode which is output as .class files
Packaging: Then, the related class files are typically bundled into WAR (Web Application Archive), EAR (Enterprise Archive), or JAR files
To demonstrate what this looks like, let’s look at the code for a very simple “Hello World” application:
// Example HelloWorld.java

public class HelloWorld {

    public static void main(String[] args) {

        System.out.println("Hello, Java Architecture!");

    }

}
Next, we would open a terminal pointed to the directory of our source code file and run:
javac HelloWorld.java
This would compile our code. During compilation, the compiler performs:
Syntax checking
Type checking
Optimization of the code
With the code compiled, we would then run by executing the java command in the same terminal, using:
java HelloWorld
Class loading
When a Java application runs, classes are loaded into memory through a relatively sophisticated loading mechanism. First, the ClassLoader reads .class files and creates binary data representations. It then moves on to linking where it performs:
Verification: Ensures bytecode follows proper format and security constraints
Preparation: Allocates memory for static fields and initializes with default values
Resolution: Replaces symbolic references with direct references
Lastly, things move to the initialization phase, where the execution process executes static initializers and initializes static fields.
Within this process, Java employs three main class loaders:
Bootstrap ClassLoader: Loads core Java API classes
Extension ClassLoader: Loads classes from extension directories
Application ClassLoader: Loads classes from the application classpath
Once the classes are loaded, the next step is for the JVM to actually execute that application.
Runtime execution
The JVM executes the application utilizing a few different mechanisms. Initially, the JVM interprets bytecode instructions one by one and uses JIT (Just-in-time) compilation for frequently executed code, compiling it into native machine code.
While the application is running, there is also automated garbage collection at work, allowing automatic memory management mechanisms to reclaim unused objects. On top of this, thread management is also in play, allowing the JVM to handle concurrent execution through thread scheduling.
Just-In-Time (JIT) vs. Ahead-Of-Time (AOT) compilation in Java
When a Java application runs, the JVM doesn’t execute bytecode as raw machine code. Instead, it uses compilation strategies that convert bytecode into native code at the optimal time—either during execution or in advance. These strategies are called Just-In-Time (JIT) and Ahead-of-Time (AOT) compilation.
Just-In-Time (JIT) compilation
By default Java uses JIT compilation, where bytecode is compiled into native machine code during runtime. The JVM starts off interpreting the code, but as it detects “hot” (frequently executed) methods, it compiles those into optimized native code on the fly using the JIT compiler. This allows the JVM to apply runtime optimizations based on actual program behavior.
Pros:
• Adaptive optimization based on real usage (e.g., method inlining, loop unrolling)
• Shorter startup time compared to AOT
• Works well for long-running applications where performance improves over time
Cons:
• May introduce small runtime pauses during compilation
• Slower warm-up performance, especially for serverless or short-lived applications
Ahead-of-time (AOT) compilation
Introduced in Java 9 and extended in later versions (e.g., via GraalVM), AOT compilation allows you to compile Java bytecode into native binaries before runtime. This is especially useful in cloud native and microservices environments where fast startup and low memory overhead are critical.
Pros:
• Much faster startup time—ideal for CLI tools, serverless functions, and microservices
• Predictable memory usage and reduced warm-up overhead
• Smaller runtime footprint in some cases
Cons:
• Fewer runtime optimizations compared to JIT
• Larger binary sizes (depending on the app and runtime)
• More complex build pipeline (e.g., native image generation with GraalVM)
When to use what?
For most traditional, long lived Java applications (like backend services), JIT is the default and works great. But for modern deployment models—like containerized apps, cold-start sensitive APIs, or serverless functions, AOT is worth considering for reducing latency and memory usage.
Additional steps in the application startup flow
For enterprise Java applications, the startup process includes additional steps:
Container initialization: For applications running in application servers or containers
Configuration loading: Reading properties files, environment variables, and other configuration
Dependency injection: Wiring application components together
Database connection: Establishing connections to databases
Service initialization: Starting various application services
Understanding the execution process helps developers optimize their applications, diagnose performance issues, and enables both developers and architects to make informed architectural decisions.
Memory management in Java
Memory management is one of Java’s defining strengths, making it easier for developers to focus on building features rather than worrying about manual allocation and deallocation. But even though Java automates most of the work through garbage collection (GC), understanding how memory is structured and managed under the hood is critical for building scalable, high-performance applications.
JVM memory structure
The Java Virtual Machine (JVM) divides memory into multiple regions, each with a distinct role in how Java applications are executed.
The heap is the main area where objects are created. It’s divided into:
Young generation: Where most objects start their life. It consists of:
Eden space: New objects are created here.
Survivor spaces (S0/S1): Objects that survive a few GC cycles are moved here temporarily.
Old generation (tenured): Objects that live long enough in the young generation are promoted here. These tend to be core application-level objects like caches or services.
Outside the heap, the JVM manages:
Metaspace: Holds class metadata, such as method definitions and bytecode. This replaced the older PermGen space in Java 8+.
Thread stacks: Each thread has its own stack, which contains method frames, local variables, and call information.
Code cache: Stores native machine code compiled from bytecode by the JIT compiler for improved performance.
Garbage collection explained
Garbage collection in Java works by automatically detecting and reclaiming memory used by unreachable objects—those with no active references in the application.
The process usually follows three steps:
Mark: GC identifies which objects are still accessible by tracing from GC roots like thread stacks and static references.
Sweep: Unreachable objects are removed, freeing up memory.
Compact (in some collectors): The heap may be defragmented to consolidate remaining objects and free space.
Java supports several garbage collection algorithms tailored to different needs:
Serial GC – Simple and suitable for small applications.
Parallel GC – Uses multiple threads to speed up collection; good for throughput.
G1 GC – Breaks the heap into regions and collects them incrementally to reduce pause times.
ZGC and Shenandoah – Advanced collectors that aim for ultra-low pause times, even on massive heaps.
You can specify the GC algorithm via JVM flags (e.g., -XX:+UseG1GC).
What about manual garbage collection?
Although Java provides System.gc() to suggest a garbage collection cycle, it’s rarely needed—and generally discouraged. Modern collectors are highly optimized, and manually forcing GC often does more harm than good (e.g., performance pauses, CPU spikes).
If your application relies on System.gc() to remain stable, it’s usually a red flag indicating deeper problems, such as memory leaks, unbounded caches, or excessive object churn.
While Java abstracts memory management away from the developer, a deep understanding of how memory is structured and reclaimed remains critical, especially for teams working on large, data-intensive, or low-latency systems.
By knowing how memory is allocated and how GC behaves, developers can design applications that are not only functional, but also performant, scalable, and resource-efficient under pressure.
Java security and performance considerations
Security and performance are the twin pillars on which any enterprise-grade Java application is built. Java offers built-in security mechanisms like bytecode verification and class loading isolation at the platform level. However, the real responsibility for security and performance lies with how developers structure and implement their applications.
Security in Java starts with the basics: protect user data, enforce access control, and validate every point of input. One of the most common mistakes developers make is embedding user input directly into SQL queries. That’s a recipe for disaster. SQL injection attacks are just one of the many risks you’ll face if you do that. Here’s an example of what a vulnerable statement would look like:
On the flip side, here’s an example of one way of doing this safely by using a PreparedStatement that ensures that SQL injection attacks are not possible.
String sql = "SELECT * FROM users WHERE username = ?";

PreparedStatement pstmt = connection.prepareStatement(sql);

pstmt.setString(1, username);
That’s just one of the many ways to handle input safely. Beyond that, secure applications use encryption libraries, validate JWTs for authentication, follow the principle of least privilege when interacting with files, networks, or databases, and integrate logging and monitoring early on to detect unauthorized access or unusual behavior across services.
Performance is where Java really shines. If you know how to read the signs, you can tune the JVM for low-latency or high-throughput workloads. Modern garbage collectors like G1 or ZGC can help minimize pause times when you know how to use them. However, most performance wins come from the application layer.
Take connection management, for example. Opening a new database connection on every request is expensive. In practice, code that does this generally looks like this:
try (Connection conn = DriverManager.getConnection(...)) {

    // do work

}
The better approach is connection pooling, where a connection can be used throughout the application instead of having individual ones spun up all the time. This is what this may look like if we were to use something like HikariCP to create and manage connection pools:
DataSource ds = new HikariDataSource();

Connection conn = ds.getConnection();
Observability plays a critical role in verifying that an application is performing as expected. , Tools like JVisualVM, JFR (Java Flight Recorder), or distributed tracing frameworks let you see how your code behaves under pressure. You can then begin to look for clues that performance is taking a hit, answering questions like are memory spikes happening after a specific API call? Are threads getting blocked unnecessarily? Being able to see these performance metrics in a dashboard allows for easier optimizations and avoids components that are performing poorly from hitting production.
Building secure, high-performance Java applications is not just about checking boxes. It’s about being aware of the risks, using the right tools, and paying attention to the details. When you do that well, Java becomes a platform you can scale with confidence.
Real-world applications of Java
Java has been proven in many real-world scenarios, especially in large-scale enterprise applications. Its platform independence, mature ecosystem, and performance have made it the language of choice in industries that require reliability, scalability, and maintainability.
In financial services, Java is used to build trading platforms, portfolio management tools, and real-time analytics systems. The language’s focus on performance, memory safety, and concurrency support makes it perfect for applications that need speed and accuracy, like algorithmic trading and risk assessment engines.
E-commerce platforms use Java to manage high traffic, secure transactions, and complex product catalogs. Its ability to support modular application structures—combined with frameworks like Spring—makes it a good choice for teams that want to build scalable backend services that can evolve over time.
For enterprise resource planning (ERP) and business process management (BPM) systems, Java’s modularity and support for multi-layered architecture allow businesses to integrate different functions like HR, finance, and supply chain into one platform. Java-based platforms have been widely adopted in these domains because of their extensibility and long-term support.
When it comes to mobile development, Java is the primary language used to build Android applications. While Kotlin is now the official language for Android, Java is still used in existing apps and is fully supported by the Android software development kit (SDK), so it’s part of the Android ecosystem.
In big data and analytics, Java powers many of the foundational technologies used for distributed processing. Frameworks like Apache Hadoop, Apache Kafka, and Apache Spark either support or are written in Java, so it’s the natural choice for building scalable data pipelines and processing engines.
Finally, cloud-native applications use Java frameworks like Spring Boot to build microservices that can be deployed using container orchestration platforms like Kubernetes. Java’s ecosystem has evolved to support cloud requirements like observability, fault tolerance, and seamless CI/CD integration.
Whether in banking, retail, logistics, or analytics, Java is the backbone of applications that need to scale, stay secure, and be maintainable over time. Its ecosystem of tools and frameworks and large community of developers ensures it remains relevant in the ever-changing technology landscape.
Java architecture examples
Java architecture becomes more meaningful when applied in practice. Let’s look at a few examples that show how different architectural patterns are implemented using Java in enterprise applications.
A classic example of Java’s layered and MVC architecture is a standard web application built with the Spring Framework. In this setup, the presentation layer is Spring MVC controllers that handle HTTP requests and route them to the appropriate service methods. The business logic is in service classes that encapsulate workflows and orchestrate actions between layers. The data access layer is typically Spring Data JPA (Java Persistence API) and provides a clean and abstracted interface to the database. Applications like internal HR portals or CRM systems use this model because of the clear separation of concerns and maintainability.
In more complex environments, Java is often the backbone of microservices-based architectures. For example, an e-commerce platform might be decomposed into independent services like Product, Order, and Payment. Each microservice is its own Java application built using Spring Boot and communicates with others via REST APIs or messaging systems like Kafka. These services are deployed in containers (e.g., Docker) and orchestrated using Kubernetes for horizontal scalability and resilience. Companies like Netflix and Amazon have popularized this approach and show how Java can power large-scale globally distributed systems.
Java is also used in data processing and analytics. Tools like Apache Spark, written in Scala but fully compatible with Java, allow developers to write Java-based Spark jobs for processing huge amounts of data. For example, a logistics company might use Java with Spark to analyze real-time delivery data and optimize routes. In this case, Java’s ability to handle concurrent processing and its deep ecosystem of libraries makes it well suited for high-throughput computing environments.
These examples show the versatility of Java’s architecture, whether it’s handling the front-end of a web app, powering independently scalable services, or crunching massive datasets in real-time. Regardless of the use case, Java’s architecture provides the modularity, reliability, and performance that modern enterprises demand.
How vFunction can help refactor and support microservices design in Java
When it comes to architecting a Java application, many organizations are opting to move towards microservices. The choice to refactor existing services into microservices or to build them net new can be challenging. Refactoring code, rethinking architecture, and migrating to new technologies can be complex and time-consuming. vFunction is a powerful tool for modernizing and managing Java applications. By helping developers and architects simplify and understand their architecture as they adopt microservices or refactor monolithic systems, vFunction’s architectural observability provides the visibility and control needed to scale efficiently and adapt to future demands.
vFunction analyzes and assesses applications to identify and fix application complexity so monoliths can be more modular or move to microservices architecture.
Let’s break down how vFunction aids in this process:
1. Automated analysis and architectural observability: vFunction begins by deeply analyzing your application’s codebase, including its structure, dependencies, and underlying business logic. This automated analysis provides essential insights and creates a comprehensive understanding of the application, which would otherwise require extensive manual effort to discover and document. Once the application’s baseline is established, vFunction kicks in with architectural observability, allowing architects to actively observe how the architecture is changing and drifting from the target state or baseline. With every new change in the code, such as the addition of a class or service, vFunction monitors and informs architects and allows them to observe the overall impacts of the changes.
2. Identifying microservice boundaries: One crucial step in the transition is determining how to break down an application into smaller, independent microservices. vFunction’s analysis aids in intelligently identifying domains, a.k.a. logical boundaries, based on functionality and dependencies within the overall application, suggesting optimal points of separation.
3. Extraction and modularization: vFunction helps extract identified components and package them into self-contained microservices. This process ensures that each microservice encapsulates its own data and business logic, allowing for an assisted move towards a modular architecture. Architects can use vFunction to modularize a domain and leverage the Code Copy feature to accelerate microservices creation by automating code extraction. The result is a more manageable application that is moving towards your target-state architecture.
4. Bring clarity and control to your Java microservices architecture: Once applications have been broken into microservices, maintaining architectural integrity in Java environments may become challenging as different teams run through rapid release cycles. vFunction helps teams govern and manage these distributed systems by continuously analyzing service interactions, detecting architectural drift, and identifying anti-patterns like circular dependencies or overly complex flows. With real-time visualization, automated rule enforcement, and deep insights powered by OpenTelemetry, vFunction ensures your Java microservices architecture stays resilient, scalable, and aligned with best practices.
Key advantages of using vFunction
Engineering velocity: vFunction dramatically speeds up the process of creating microservices and moving monoliths to microservices, if required. By streamlining the Java architecture, vFunction helps modernized legacy applications increase deployment velocity, making it easier for teams to deliver updates faster, with fewer delays and less risk.
Increased scalability: By helping architects view their existing architecture and observe it as the application grows, scalability becomes much easier to manage.. With insights into service interactions, modularity, and system efficiency, teams can identify bottlenecks, improve component design, and ensure their applications scale smoothly as demand grows.
Improvedapplication resiliency: vFunction’s comprehensive analysis and intelligent recommendations increase your application’s resiliency by supporting a more modular architecture. By seeing how each component is built and interacts with the other, informed decisions can be made in favor of resilience and availability.
Conclusion
Java’s architecture, spanning platform and application aspects, underpins its enduring success with features like “Write Once, Run Anywhere,” strong memory management, and security. By grasping JVM, JRE, JDK, and key application patterns, such as layered architecture and microservices, developers can craft scalable, secure Java apps. Understanding the execution process, memory management (including garbage collection), and optimizing performance contribute significantly. Real-world applications in varied sectors showcase Java’s adaptability.
By prioritizing security and performance, developers create applications tailored for modern enterprise needs. Java’s evolving nature is complemented by tools like vFunction and frameworks like Spring Boot for managing and evolving complex systems. This foundation equips developers to ensure their Java applications stay resilient, efficient, and ready for what’s next.