

If you’re building software, chances are you have various software dependencies within your code base. These dependencies are on external components like libraries, frameworks, or modules that are part of almost every modern application. Just like how each puzzle piece is crucial to completing the picture, every dependency is essential for building and running your software application efficiently.
The modern software landscape is built upon a vast ocean of reusable code, enabling developers to speed up development and leverage existing high-quality software components maintained by a community of experts. However, these dependencies may also introduce complexity and require maintenance over time. Managing dependencies well is critical for application stability, security, and performance. A single poorly managed dependency can bring down the entire system.
This blog will explore the essentials of software dependencies, including their types, management techniques, and tools. Ideal for both seasoned developers and newcomers, mastering dependency management is crucial for efficient and secure software development.
What is a software dependency?
At its core, a software dependency describes a relationship where one piece of software relies on another to function properly. Think of them as components added to your application to enable its functionality. Modern software applications rarely exist in isolation, typically building on existing code, libraries, and frameworks, incorporating essential functionality to avoid starting from scratch.
To illustrate how this can work, consider a web application built using a framework like React. The use of React is a dependency; without it, the application won’t work. Another example would be a Python script that performs complex mathematical operations using the NumPy library. NumPy provides optimized computation capabilities. Developers don’t need to build these components from scratch. Instead, they include the dependency and use its functionality within their app.
Dependencies allow developers to focus on their application’s unique parts rather than re-invent standard and common functionality. They enable code reuse and speed up development cycles and standardization. However, using dependencies introduces a chain of interconnected components that need to be managed.
Dependencies include:
- Libraries: Collections of pre-written code that provide specific functionality.
- Frameworks: Structural foundation that provides a template for building applications.
- Modules: Self-contained units of code that provide specific features.
- APIs (Application Programming Interfaces): Interfaces that allow different software components to talk to each other.
Essentially, any external component an application relies on to work is a software dependency. Understanding this fundamental concept is the first step to managing dependencies effectively.
How do you identify software dependencies?
The first step in dependency management is identifying them. Without this knowledge, you risk version conflicts, security vulnerabilities, and runtime errors. Understanding your dependencies—their uses and potential issues—is crucial for efficiency and stability.
Identifying dependencies can vary depending on the programming language, development environment, and tools used. Several common ways exist, from highly straightforward to less standard approaches. Let’s take a look at some of them.
Package and build managers
Most modern programming languages have package and build managers that automate the process of installing and managing dependencies. For example, Node.js has npm (Node Package Manager) or yarn, Python has pip, Java has Maven or Gradle, and .NET has NuGet. These tools use a manifest or build files (like package.json, requirements.txt, or pom.xml) that specify all the project’s direct dependencies. By looking at this file, developers can quickly see the libraries and frameworks their application relies on. Some code IDEs visualize these dependencies and list all the derived/indirect dependencies brought by the direct dependencies
Software Composition Analysis
Software Composition Analysis (SCA) tools identify and manage security risks, outdated dependencies and licensing issues in your software. Modern applications rely on open source components but without oversight, these can introduce vulnerabilities and legal risks. SCA tools scan your projects to find all direct and transitive dependencies, cross check them against vulnerability databases and highlight the risks. They also ensure open source license compliance and recommend secure and up to date versions of libraries. By hooking SCA into your development workflow using tools like Snyk, Black Duck, Sonatype Nexus, and GitHub Dependabot, you can secure your applications proactively and reduce risk with minimal overhead to your development effort.
Manual inspection
While automated tools are helpful, manual inspection of the codebase is still essential. Reviewing import statements, library calls, and project documentation can provide valuable insights into the dependencies on which your application relies and in which context. This is especially important for identifying unnecessary dependencies that can be removed and simplify the implementation. It also helps, in the case of relying on a manifest file, to see which dependencies are actually used. For instance, in Node, to use a dependency in a component, you have to import it explicitly. Inspecting the code will allow you to verify this since manifest files may include dependencies that aren’t actually used upon manually inspecting the code.
Build tool outputs
Build tools typically list resolved dependencies in their output, revealing direct and transitive dependencies used in your application’s construction. However, this method can be unreliable as builds may omit dependencies included in prior iterations, complicating the identification of newly installed dependencies. This approach is least advisable and should be considered a last resort, such as when source code is inaccessible but build logs are available.
Developers can use one or more of these methods to get a complete picture of their application’s dependencies. That said, not all dependencies are equal or straightforward.
Static and dynamic analysis
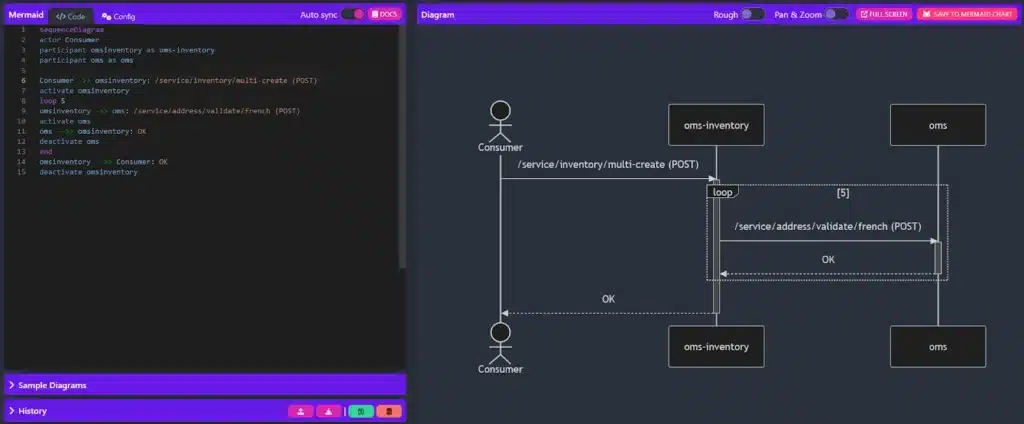
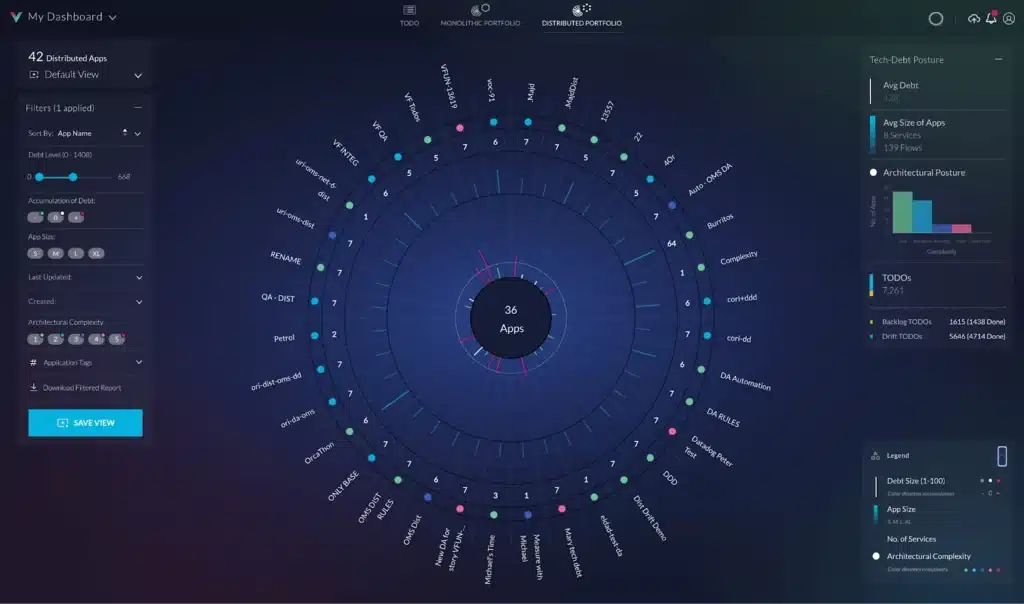
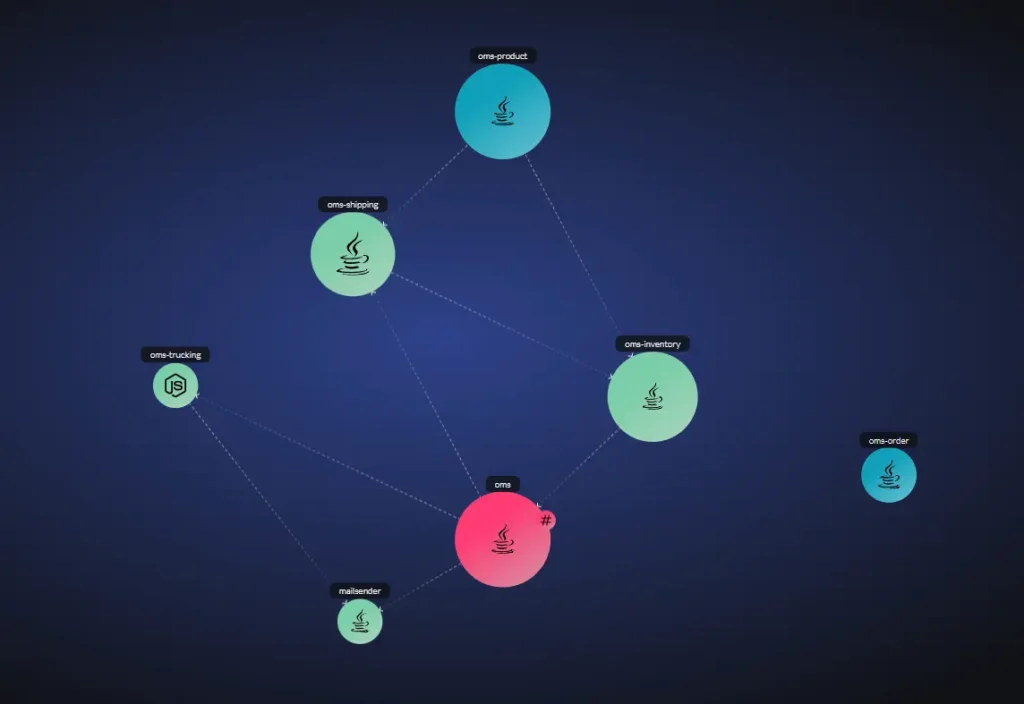
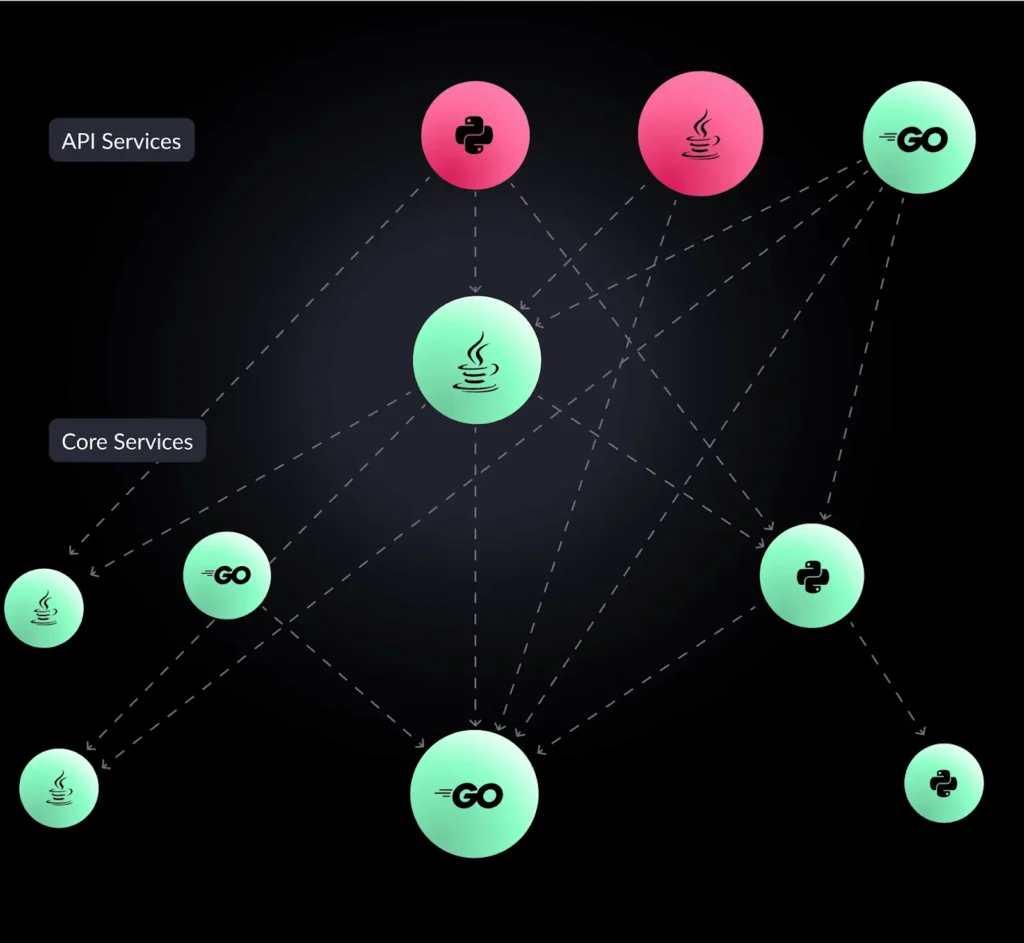
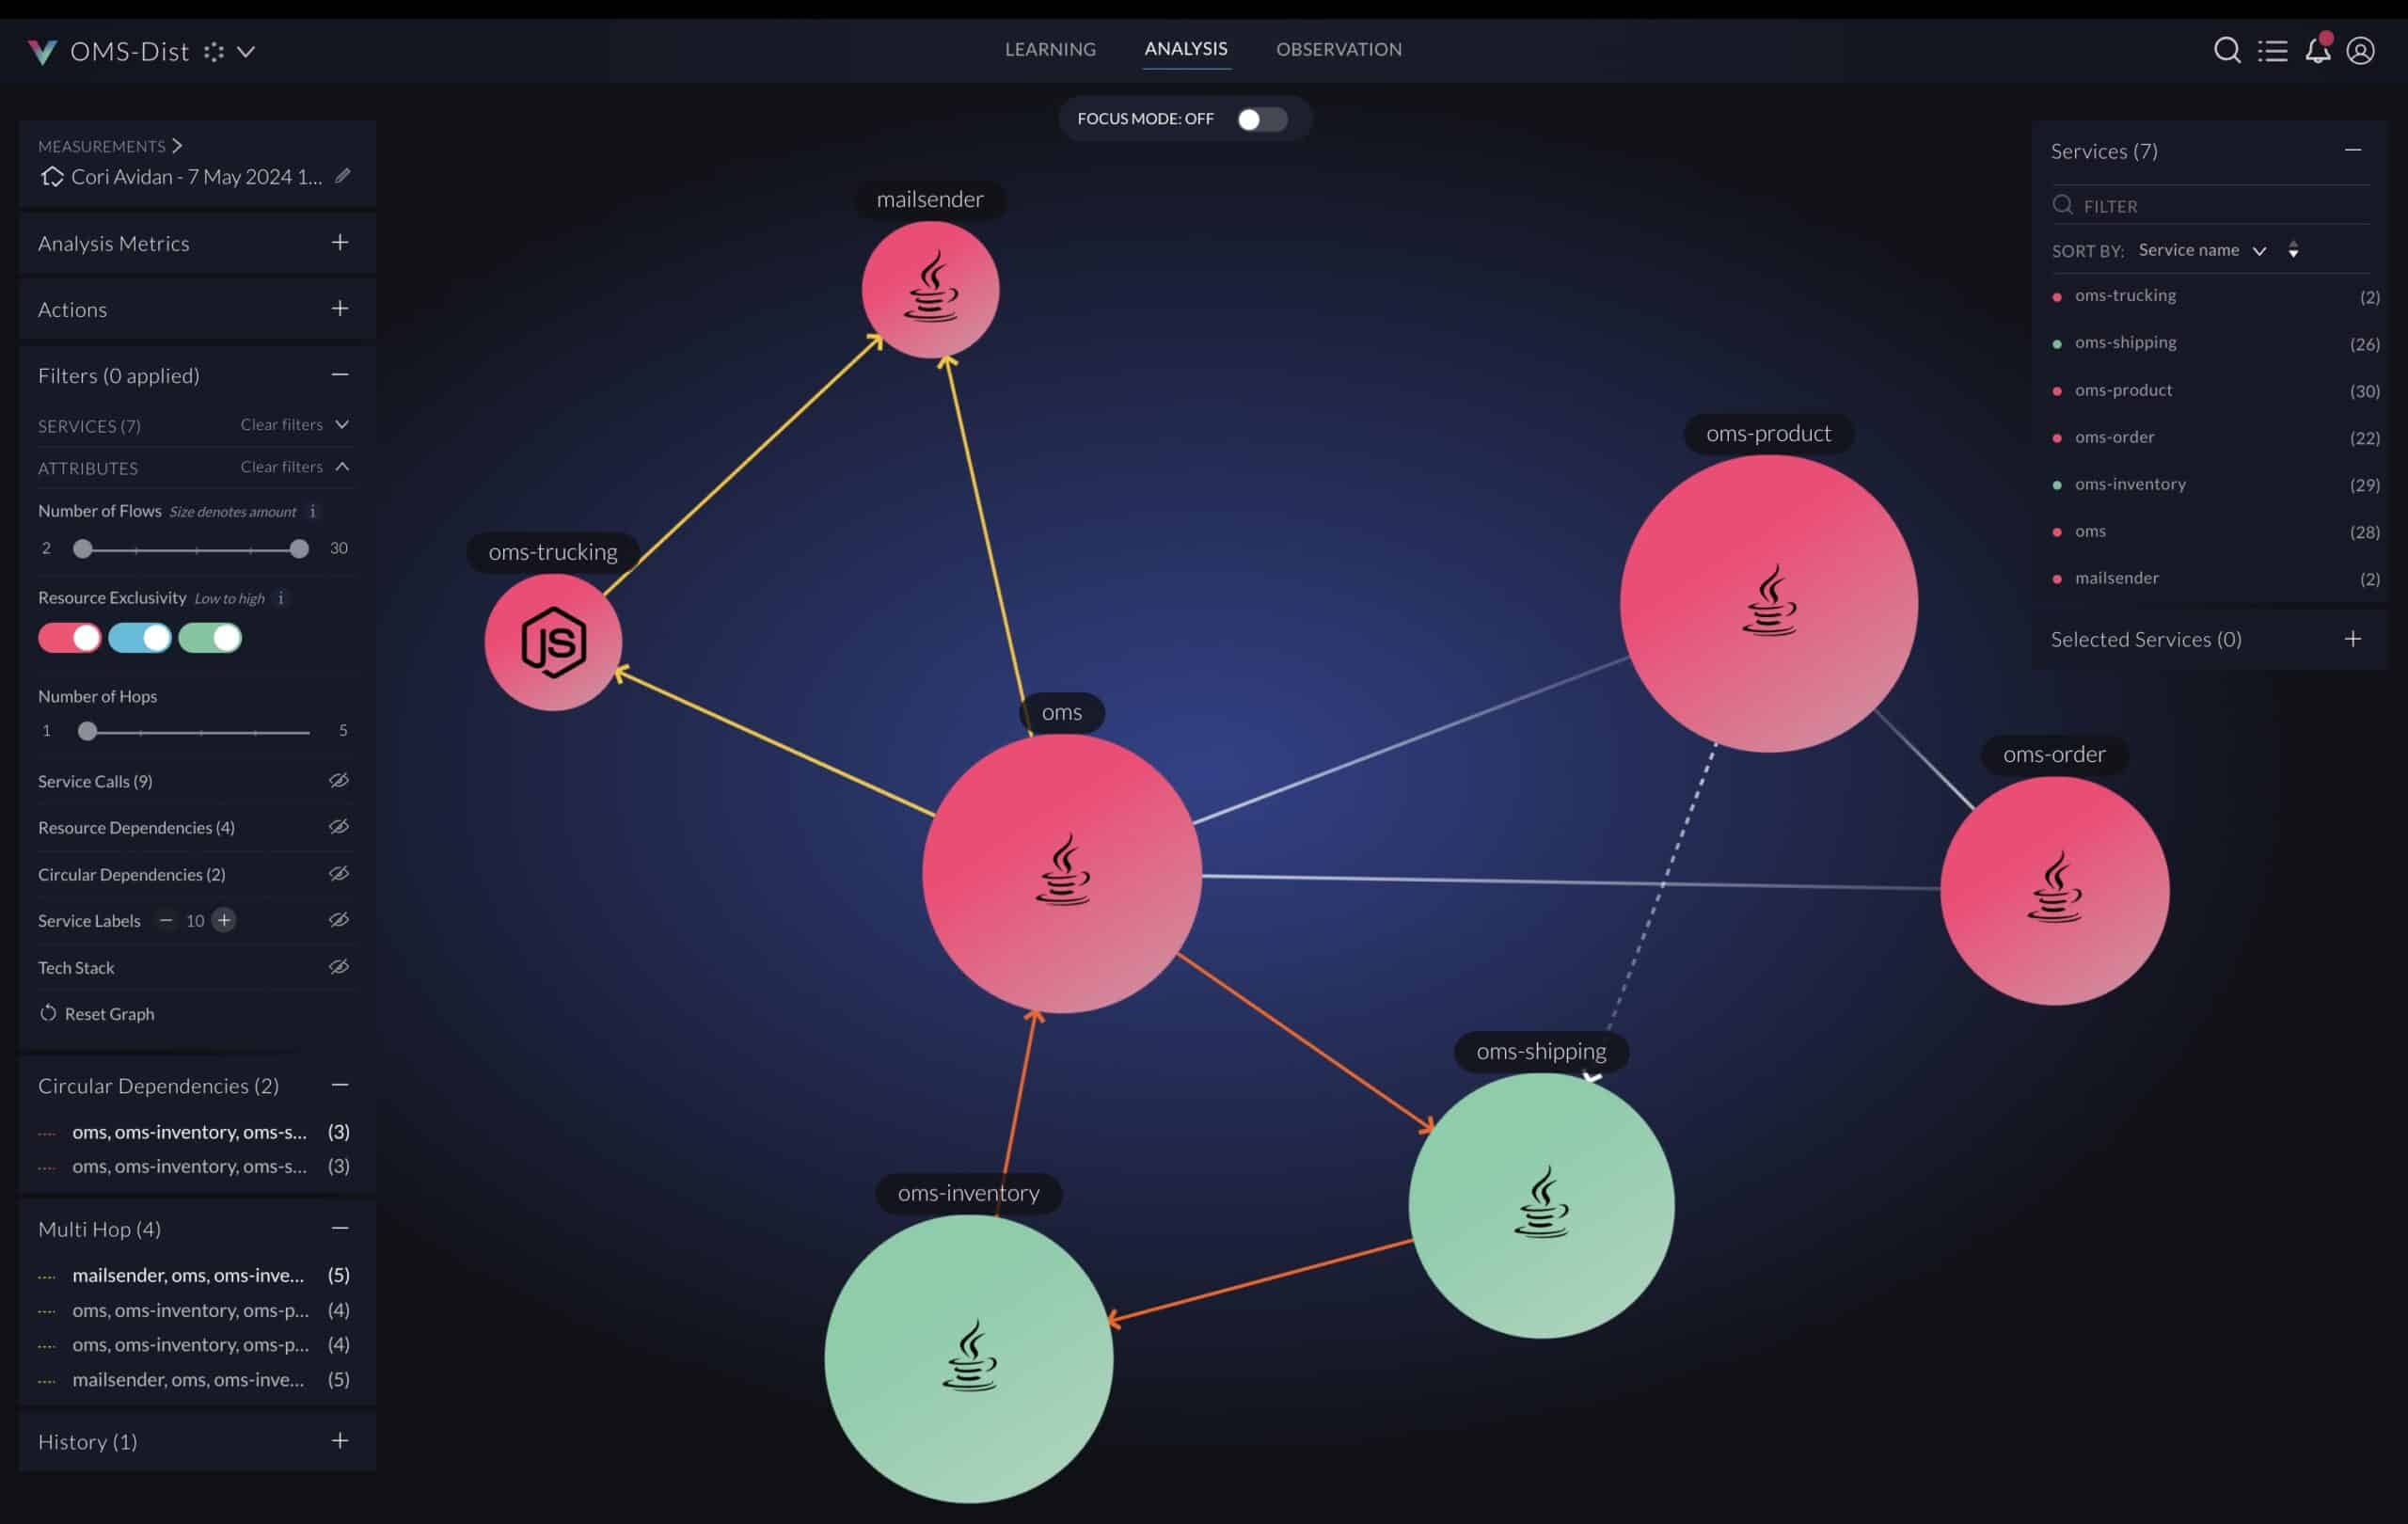
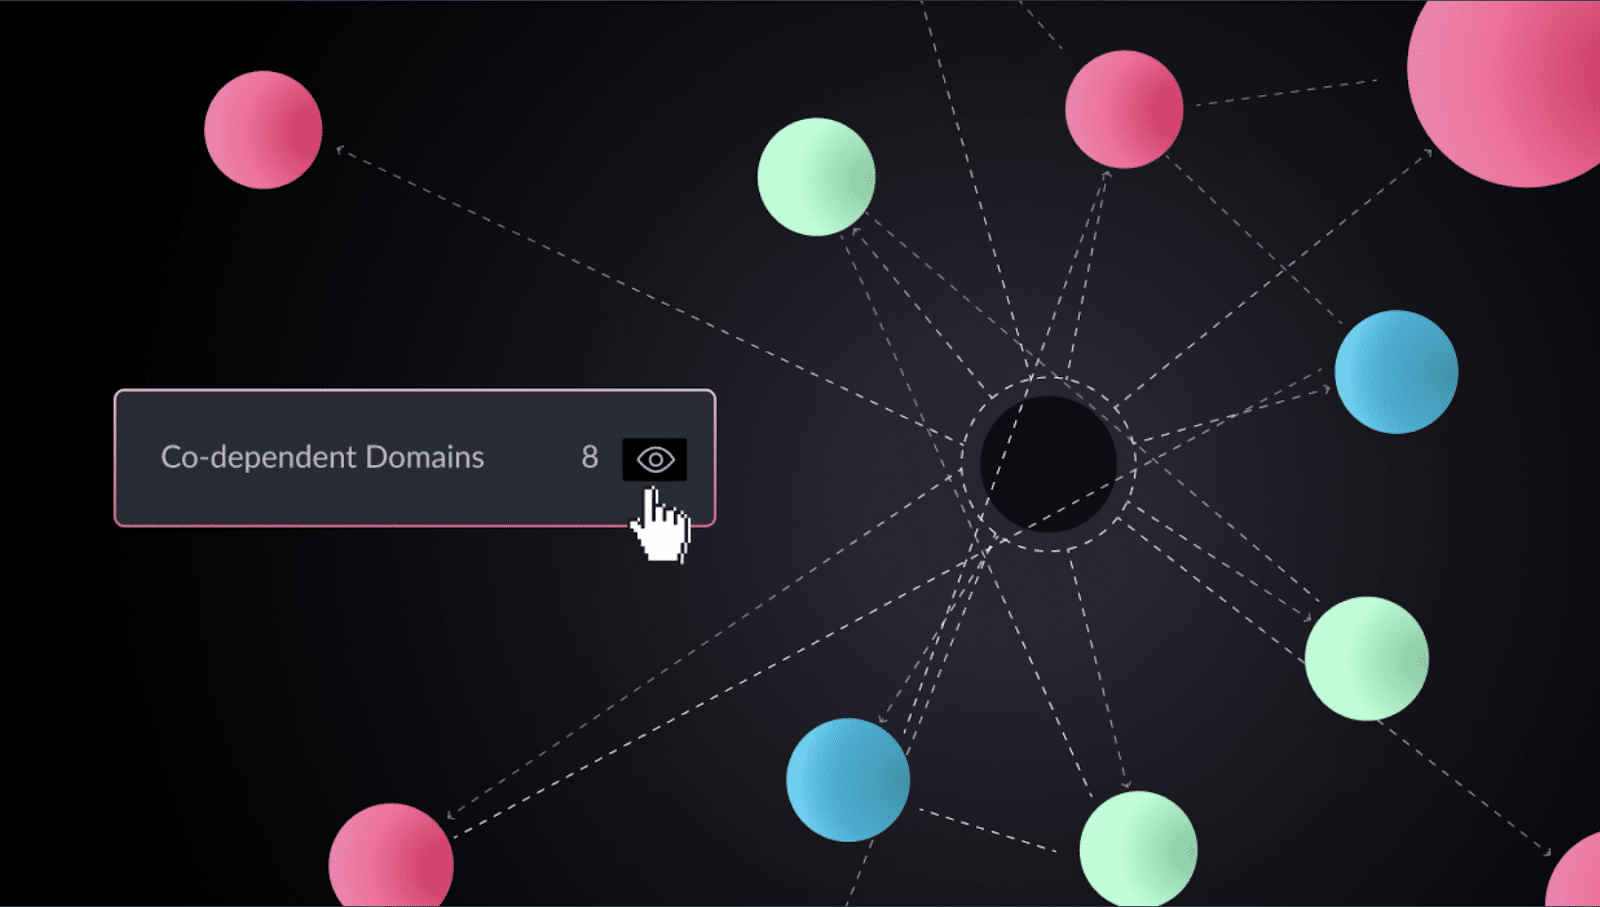
Architectural observability pioneer, vFunction, can visualize the dependencies between software components within Java and .Net monolithic applications, including the details of which classes are using the dependencies and if there are any circular dependencies (which is a design flaw that must be corrected).
Dynamic analysis identifies dependencies in runtime, while static analysis composes a full dependency graph between the classes. Static and dynamic analysis methods complement each other, as some components might not be used at runtime. Some dependencies might be detected at runtime even if the binaries provided to the static analysis are missing or some software elements used by the application are generated at runtime.
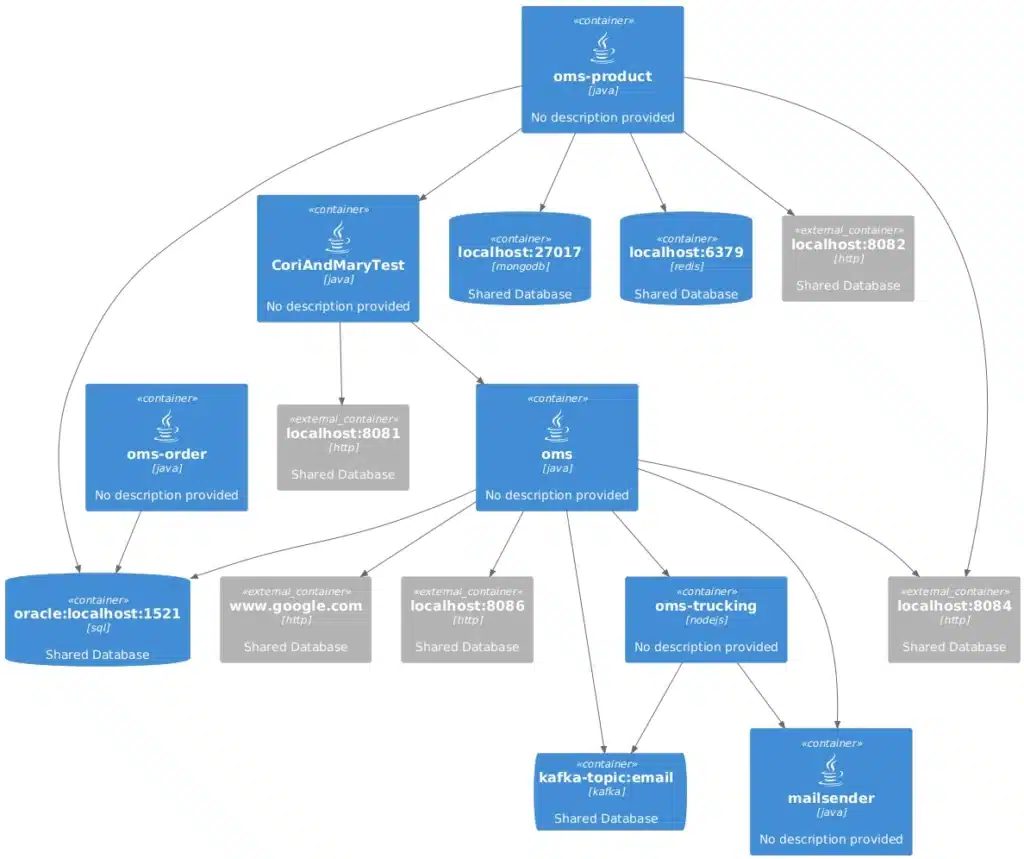
Below is an extreme example from a highly complex Java monolithic application that is partitioned to many JAR (Java ARchive) libraries. Every node in the graph is a JAR file and every line is a dependency between the JAR files. The orange lines highlight circular dependency paths which are nontrivial bidirectional relationships in this case (as seen in the graph). A circular dependency is a critical architectural design flow creating complexity which may lead to build and runtime malfunctions that are hard to diagnose and fix, as well as a maintenance issue due to the tight coupling between the library components.
Hovering over a line in the below graph lists the dependencies between classes across the two jar files.
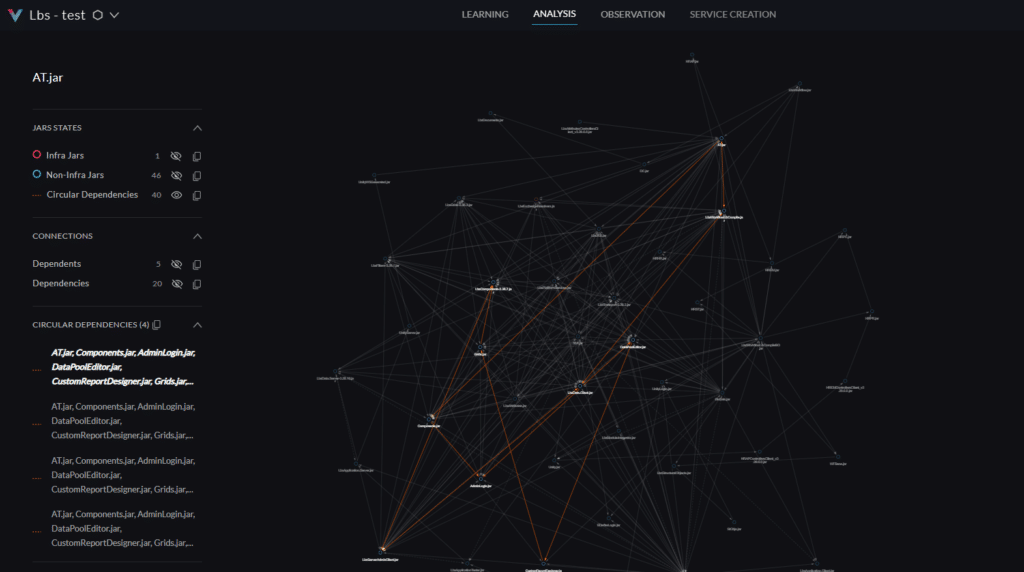
Graph in vFunction highlighting dependencies between JAR files.
Types of software dependencies
There’s a reason why they call it “dependency hell.” Modern software generally contains a complex web of dependencies, where each dependency can recursively rely on others, creating a multi-tiered structure that is far from ideal. They come in various forms, each with its own characteristics and implications for your project. Understanding these distinctions is crucial for management and anticipating how dependencies may impact your project.
Direct dependencies
Direct dependencies are the libraries or packages your project explicitly declares and imports. They are the components you’ve consciously chosen to include in your application. For example, if you’re building a web application with Node.js and you use the Express package for routing, Express is a direct dependency. Direct dependencies are the easiest to identify and manage in most modern languages or frameworks, as they are usually listed in the project’s manifest file (e.g., package.json, requirements.txt)..
Transitive dependencies
Transitive dependencies, or indirect dependencies, are the libraries that your direct dependencies rely on to function (a direct reference to dependency hell that we discussed earlier). For instance, if Express relies on the debug package for logging, debug is a transitive dependency of your application. Transitive dependencies can create a complex web, making it hard to understand the full scope of your application’s dependencies. They can introduce security vulnerabilities or version conflicts that slip under the radar if not managed carefully. This is where tooling can help determine if transitive dependencies introduce risk or security issues.
Development dependencies
Development dependencies are the tools and libraries required in the development process but not for the application to run in production. Examples include testing frameworks (e.g., Jest, JUnit), linters (e.g., ESLint, PyLint), and build tools (e.g., Webpack, Gradle). These dependencies help improve code quality, automate testing, and streamline the development workflow. They are usually separated from production dependencies to minimize the size and complexity of the deployed application.
Runtime dependencies
Runtime dependencies are the libraries and packages required for the application to run in the production environment. These dependencies provide the core functionalities the application relies on. Examples include database drivers, web frameworks, and networking libraries. Managing runtime dependencies is critical for application stability and performance.
Optional dependencies
Optional dependencies are dependencies that enhance the application’s functionality but are not strictly required for it to run. They provide additional features or capabilities that users can choose to enable. For example, a library might offer optional support for a specific file format, database, or operating system. Optional dependencies allow developers to provide a more flexible and customizable application that only includes these dependencies if required for their specific use case/build.
Platform dependencies
Platform dependencies are specific to your application’s operating system or environment. These dependencies may include system libraries, device drivers, or platform-specific APIs. Managing platform dependencies can be challenging as they often require careful configuration and testing across different environments. Modern portable languages and containerization reduce, but do not completely eliminate these issues that arise in specific scenarios.
Most dependencies fall somewhere within this spectrum. Understanding the different types of dependencies allows developers to make informed decisions about dependency management, ensuring the dependencies used are needed but also ensuring they are stable, secure, and performant. Now let’s look at some common ways to manage them within an application’s code base.
How do you manage software dependencies?
Managing software dependencies is not just about installing the libraries and going forward with adding anything and everything to your project; it has to be more pragmatic. Part of the pragmatism of dependency management is about having a process to ensure the dependencies used within your application are stable, secure, and maintainable throughout its life. Effective dependency management combines best practices, tools, and vigilance (especially regarding security and performance). Let’s look at some common best practices for managing dependencies.
Use a package manager
Package managers are essential tools for managing dependencies. They automate the installation, update, and removal of dependencies, as well as maintain consistency across different development environments. Package managers also resolve version conflicts and have a centralized repository for dependencies. Most languages have a preferred package manager, so getting started is generally not too hard; choose a package manager that fits your language and project (e.g., npm for Node.js, pip for Python, Maven for Java) and begin using it.
Pin versions
Version pinning specifies the exact version of each dependency your application requires. This prevents changes due to automatic updates, which can introduce breaking changes or compatibility issues. By pinning versions, you ensure your application always uses the tested and compatible versions of its dependencies. But review and update pinned versions periodically to get the bug fixes and security patches, potentially bumping the pinned version up while also performing regression testing for compatibility.
Scan dependencies
Use security scanning tools to scan your dependencies for known vulnerabilities regularly. These tools scan your project’s dependencies against vulnerability databases and alert you to potential security risks. This proactive approach helps identify and fix security issues before they can be exploited. Integrate dependency scanning into your CI/CD pipeline to catch vulnerabilities early in development. Integrating scans into each commit process ensures early detection of issues, allowing developers to address problems before they reach production. This is a big component of the “shift-left” movement and mindset.
Keep dependencies up-to-date
Keeping your dependencies up-to-date is crucial for getting bug fixes, performance improvements, and security patches. Tools like Dependabot can be really helpful in automating this. Remember that updating dependencies can also introduce risks, as new versions may introduce breaking changes. Have a clear process for updating dependencies, including testing and rollback mechanisms, to minimize the risk of downtime. You likely also want to consider using semantic versioning to understand the impact of updates as you roll out newer versions of your app with update dependencies.
Isolate dependencies
Use virtual environments or containers to isolate dependencies for different projects. This prevents conflicts between dependencies that may have different versions or requirements. Virtual environments create isolated spaces where each project has its own set of dependencies, so changes to one project won’t affect the others. Containers provide a more comprehensive isolation mechanism, packaging the application and its dependencies into a portable unit.
Document everything
Document your project’s dependencies, including versions, purposes, and specific configuration requirements. This will be a valuable resource for developers to understand the application’s dependencies and troubleshoot issues. To make things even easier, you can usually access or even generate certain sorts of documentation right from your package manager itself. For instance, you could use npm docs or pip show to help access and generate documentation from your package manager command line interface (CLI).
vFunction provides a report of standard Java and .Net libraries to detect the usage of aging frameworks as seen in the table below. A library or framework is marked aging if the version has an older non-minor version or it is more than two years old.
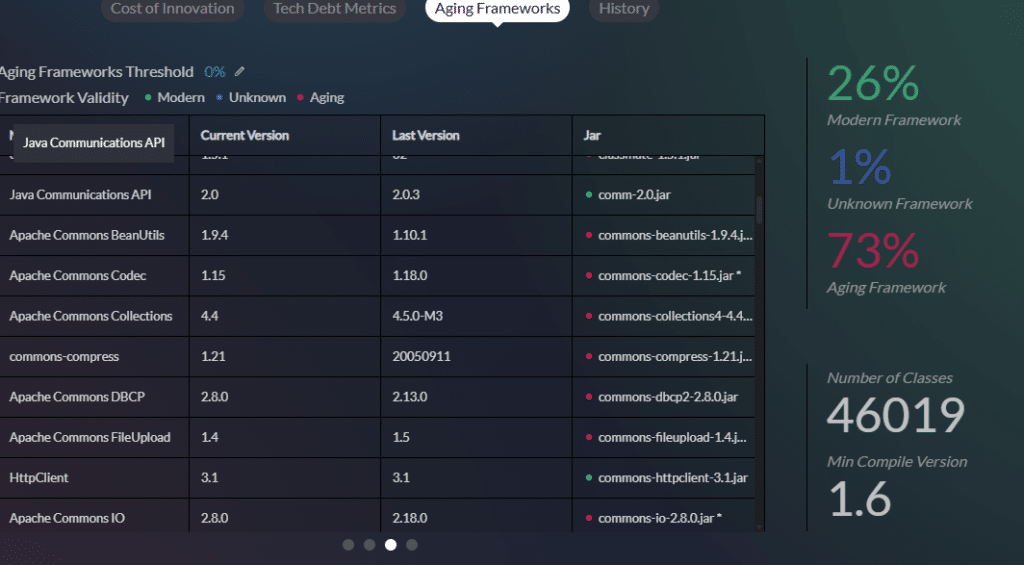
vFunction generates a report identifying aging Java and .Net libraries.
Do a dependency audit
Lastly, regularly audit your project’s dependencies to remove unused or outdated ones. Unused dependencies increase the size and complexity of your application, while outdated dependencies can introduce security vulnerabilities. Use depcheck or pip-check to remove unused dependencies from your project.
Following these best practices and using the right tools will give you a well-rounded dependency management process. Since dependencies are crucial to how your software functions, it makes sense to closely monitor which dependencies are used and how. Want a bit more clarity on what dependencies are? Let’s examine some examples next.
Software dependencies examples
Let’s see some concrete examples of software dependencies across different programming ecosystems:
Web application (Node.js)
Imagine a modern web application built with Node.js. To build such an application, we would mostly likely use one or more of the following dependencies:
- Express.js: A web framework for routing, middleware, and HTTP requests.
- MongoDB Driver: A library that interacts with a MongoDB database.
- React: A JavaScript library to build user interfaces with a component-based approach.
- Axios: A library to make HTTP requests to external APIs or services.
- JWT (JSON Web Token): A library to implement authentication and authorization.
Data analysis script (Python)
When using Python to analyze data, most developers and data scientists use various dependencies to help them. Here are a few common ones you’d most likely see in a data analysis script:
- NumPy: A fundamental library for numerical computing with array objects and mathematical functions.
- Pandas: A data manipulation and analysis library with DataFrames for efficient data handling.
- Matplotlib: A library to create static, interactive, and animated visualizations.
- Scikit-learn: A machine learning library with tools for classification, regression, clustering, and dimensionality reduction.
Mobile application (Android – Java/Kotlin)
For mobile apps, using a vast amount of dependencies is also the norm. For instance, in Android mobile app development, you might find:
- Retrofit: A type-safe HTTP client.
- Gson: A library to convert Java objects to JSON and vice versa.
- Glide: An image loading and caching library.
- Room Persistence Library: An abstraction layer over SQLite.
These examples show how dependencies are the foundation of various software projects. Although these are very simple examples, it does demonstrate how many of the core functions we bring into our applications are handled by dependencies. So, how do you bring these dependencies into your project? As mentioned before, this will likely require some dependency management tools to handle.
Software dependency management tools
If your project is using dependencies (which almost every one will be), managing them is key to any software project. Luckily, there are many tools to help with that, automating tasks and providing insights and order to the complex world of dependencies. Here are the most popular and widely used dependency management tools across a variety of common languages:
npm (Node Package Manager)
Language: JavaScript
Description: The default package manager for Node.js, npm, gives you access to a massive registry of JavaScript packages to easily find and install the dependencies your project needs.
Features:
- Simple package installation and management.
- Version management (specifying ranges or pinning to specific versions).
- Automatic dependency resolution.
- Ability to publish your own packages.
pip (Python Package Installer)
Language: Python
Description: Pip is the standard package manager for Python, and it simplifies the installation and management of Python packages from the Python Package Index (PyPI) and other repositories.
Features:
- Straightforward package and dependencies installation.
- Tools for virtual environments to isolate project dependencies.
- Supports different versioning schemes.
- Ability to install from source code or wheels.
Maven
Language: Java
Description: A build automation tool that excels at dependency management, primarily used for Java projects. It uses a declarative approach with dependencies documented within a pom.xml file.
Features:
- Central repository (Maven Central) for easy access to dependencies.
- Standardized build lifecycle with phases for compile, test and package.
- Extensive plugin ecosystem.
- Support for multi-module projects.
Gradle
Language: Java, Kotlin, Groovy, and others
Description: A flexible and highly customizable build automation tool that also provides dependency management. It uses a Groovy-based DSL to define builds and dependencies.
Features:
- Incremental builds for performance.
- Support for many languages and platforms.
- Powerful dependency management with support for multiple repositories.
- Extensible with plugins and custom tasks.
Chances are that if you are already working in these languages, you are already using these tools. These tools, each with its strengths and focus, make modern software development much easier with their approach to dependency management. Although dependencies can be added to a project manually, these tools make this process much easier and scalable.
vFunction: Dependency management at the architectural level
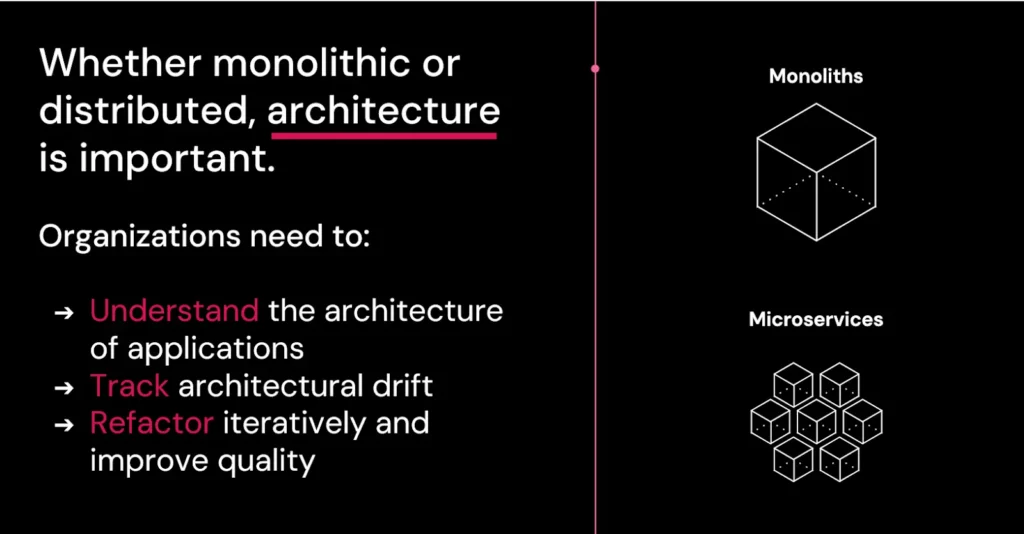
Traditional dependency management tools typically focus on individual packages and libraries. In contrast, vFunction takes a broader approach, managing dependencies at the architectural level. To build quality software, clean architecture is essential—it has far-reaching impacts across the entire application. This means reducing unnecessary architectural dependencies. As an architectural observability platform, vFunction enables teams to visualize, analyze, and manage dependencies within the context of the overall application architecture.
vFunction’s key features for dependency management are:
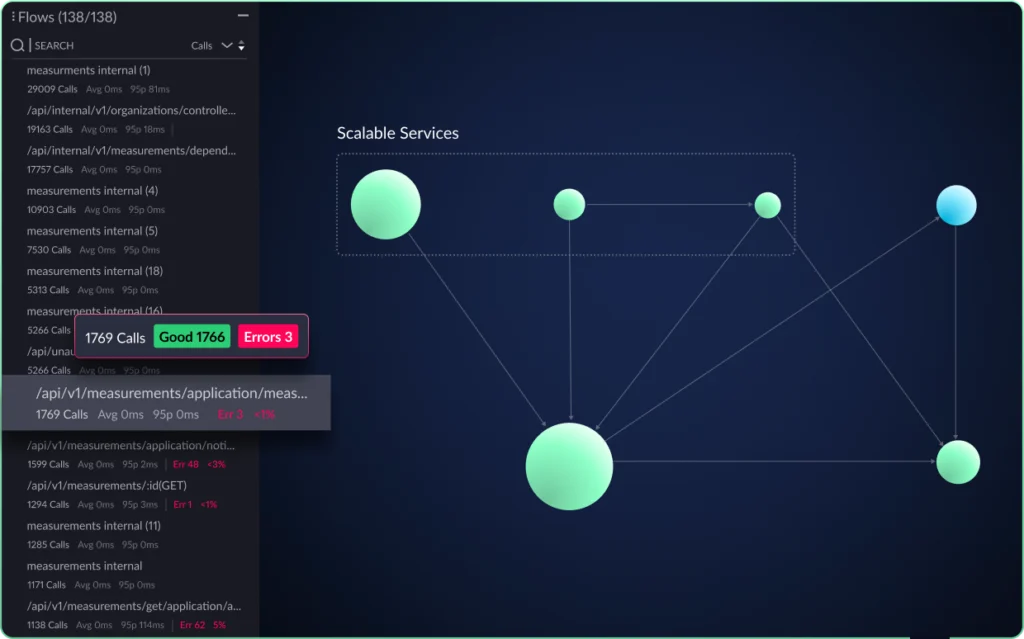
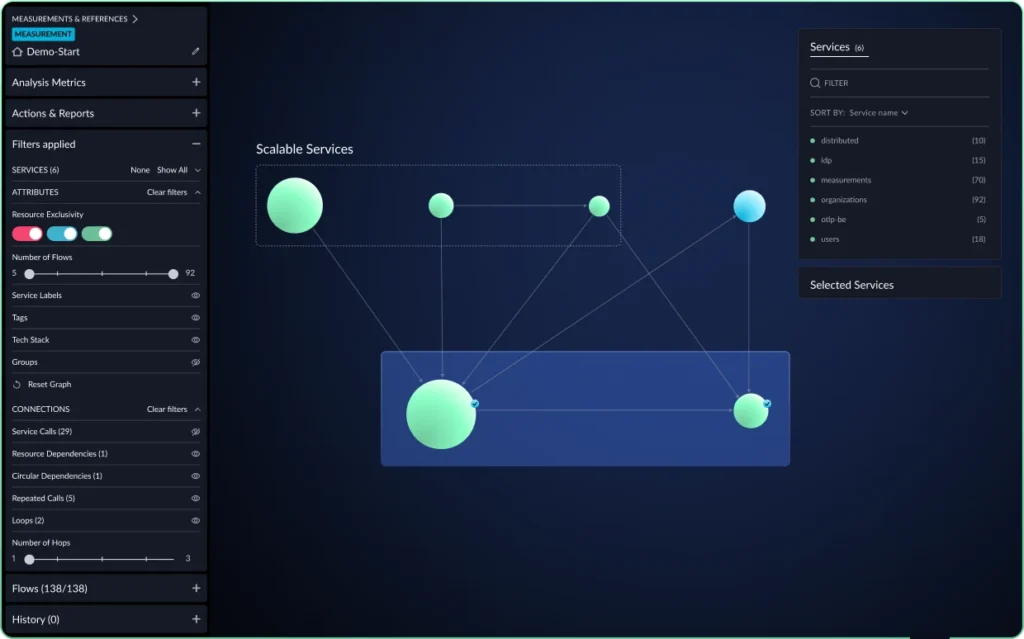
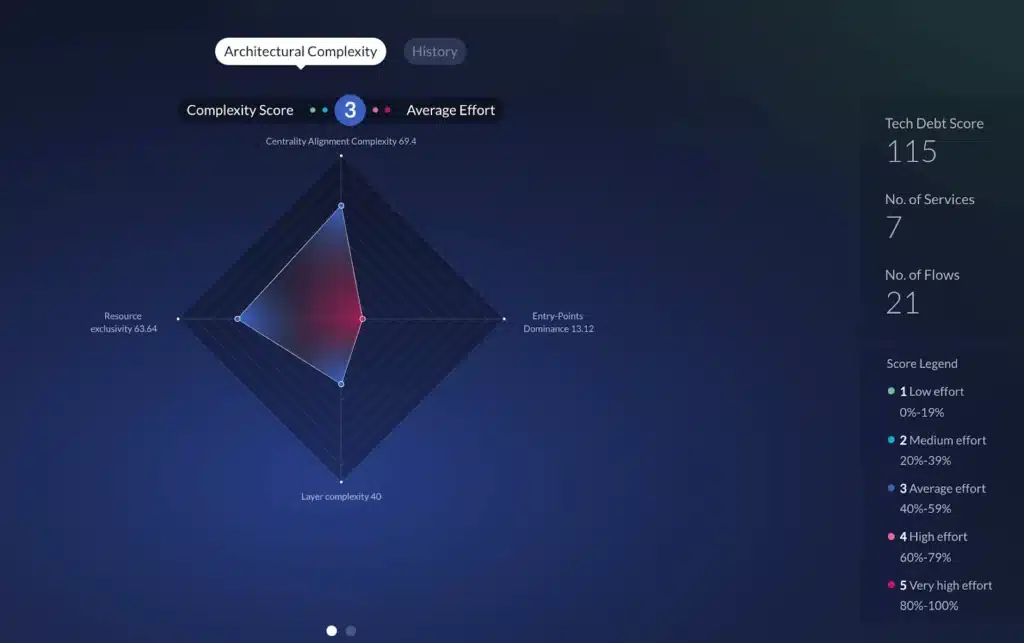
- Visualizing architectural dependencies: vFunction generates interactive diagrams that map out the dependencies between different components and services in your application. This gives you a clear and complete view of how different parts of your system interact.
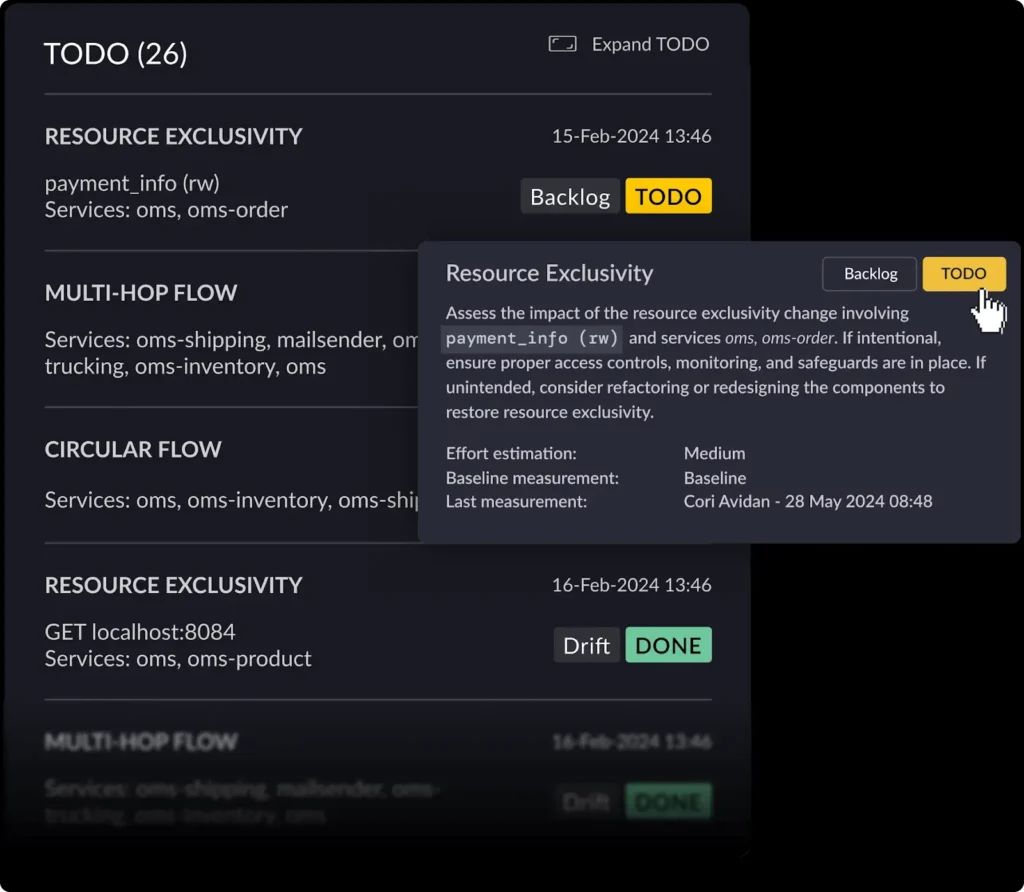
- Detecting architectural drift: As applications evolve, their architecture can drift from its original design, often because of new planned or unplanned dependencies or changes in how components interact. vFunction detects this drift and helps you maintain architectural integrity.
- Analyzing the impact of changes: Before making changes to your application, vFunction allows you to analyze the potential effect of changes on dependencies and the architecture. This helps you avoid unintended consequences and make changes safely.
- Managing technical debt: vFunction identifies and helps manage technical debt related to dependencies, including outdated libraries and complex issues like circular dependencies between services and components. This insight allows you to prioritize refactoring and improve your application’s long-term maintainability.
vFunction goes beyond simply showing the dependencies within your code. It illustrates how individual modules and internal dependencies are connected and function within the broader system. This holistic approach gives teams a complete view of code and architectural dependencies, highlighting their impact on the overall application architecture. As a result, vFunction empowers teams to make more informed decisions, reduce risk, and enhance the health and maintainability of their applications.
Conclusion
Software dependencies are the building blocks of modern software development. They let developers reuse code, speed up development, and build complex applications more efficiently. Managing these dependencies is crucial to application stability, security, and maintainability.
Throughout this blog, we’ve covered the different aspects of software dependencies, from their definition and types to the challenges and best practices for managing them. We’ve looked at traditional package managers like npm, pip, Maven, and Gradle, as well as vFunction, which offers an architectural perspective on your projects’ dependencies.
Ready to take control of your software architecture and dependencies?
Try vFunction for free and experience the power of architectural observability. Gain a deeper understanding of your application’s dependencies, identify potential risks, and make informed decisions to improve the health and maintainability of your software.