Applications are the lifeblood of modern businesses. Yet many organizations find themselves burdened by existing legacy applications that can stifle growth and innovation. Application modernization is the process of revitalizing outdated applications to align with current business needs and take advantage of the latest technological advancements.
This guide will delve into the fundamentals of application modernization—what it is, why it’s crucial, and proven strategies for success. We’ll uncover the benefits, essential tools, and best practices that will help your applications thrive in today’s digital landscape. Whether you’re an architect, a developer, or part of a team looking to future-proof your tech stack, this guide will be your roadmap to successfully modernizing legacy applications.
What is application modernization?
Application modernization goes far beyond basic maintenance or upgrades. It represents a fundamental shift in how you approach your legacy applications, transforming them into adaptable, cloud-ready solutions using the latest application modernization technology. As technology advances, modernization has also morphed. Application modernization can encompass techniques that range from breaking down monolithic applications into independent microservices to embracing containerization and cloud-based deployments. It may involve integrating cutting-edge technologies like artificial intelligence or serverless functions to unlock new capabilities that the business requires but are not possible in the application’s current state.
Modernizing applications isn’t confined to the code itself. It influences the entire application lifecycle. This means re-evaluating your development methodologies, integrating DevOps principles, and setting up the organization and existing applications for continuous improvement and innovation. While application modernization can be a significant undertaking, it’s often viewed as an essential investment rather than simply a cost. Successful modernization projects deliver enhanced agility, reduced technical debt, and a competitive edge.
Why modernize your applications?
Legacy applications, once the backbone of operations, can transform into significant liabilities that stifle innovation and drain resources. Implementing a robust application modernization strategy addresses these challenges while unlocking substantial benefits for your organization. Here’s what drives the need for modernization and what you gain from it:
Technical debt slows innovation
Older systems accumulate inefficient architectures, complex dependencies, and outdated programming practices. This technical debt makes any change slow, expensive, and prone to unintended consequences. Modernization and the adoption of the latest tools and frameworks help streamline workflows and automate tasks. This frees up your team to focus on innovation, reduces operational overhead, and shortens time-to-market. Changes can be made rapidly and confidently as market needs fluctuate.
Limited agility and scalability
Monolithic architectures and inflexible deployment models make even minor updates challenging, preventing businesses from responding quickly to market changes or customer demands. Legacy systems struggle to handle increased traffic, data growth, or new functionality, creating bottlenecks and frustrating user experiences. Modernized applications are designed for rapid change. By leveraging cloud-native architectures and technologies such as containerization, businesses can roll out new features faster and with greater confidence while gracefully handling fluctuations in demand. This agility allows you to respond swiftly to customer feedback and market trends, ensuring peak performance without unnecessary infrastructure costs.
Security vulnerabilities and risks
Outdated applications often contain known vulnerabilities or dependencies that are no longer actively supported, exposing businesses to cyberattacks that can result in data breaches, downtime, and reputation damage. Application modernization improves security posture by leveraging the latest infrastructure and frameworks and consistently patching them. This allows organizations to fix vulnerabilities and implement advanced security protocols as they become available, including the latest approaches like zero-trust architectures to protect sensitive data and maintain customer confidence.
Rising costs
The upkeep of outdated applications becomes a significant drain on resources. As applications age or are required to scale, organizations face ballooning infrastructure costs and dependence on expensive legacy vendors. Finding developers with the necessary skills to maintain legacy technologies is increasingly difficult and costly. Cloud adoption, shedding outdated hardware dependencies, and optimizing development processes can dramatically reduce long-term IT expenses and total cost of ownership. Modernized applications generally cost less to maintain, update, and scale.
Overall, application modernization results in more resilient, secure, agile, and cost-effective applications. A successful modernization project delivers the competitive edge businesses need to thrive in today’s digital landscape. To get on the right track, let’s look at some common modernization patterns.
Application modernization patterns
Successful application modernization draws upon several established patterns. Choosing the right approach—or, more likely, a mix of approaches—requires careful analysis of an application’s current and future state functionalities, an organization’s business objectives, and the resources available to undertake the modernization project.
The “Rs” of modernization
The application modernization framework, known as the “Rs” of modernization, is a helpful starting point when planning application modernization. Before diving into modernization approaches, it’s worth noting that not every legacy application requires transformation. Sometimes the best path forward is to replace with a commercial solution, keep what works, or retire systems that no longer serve the business. Once you’ve determined that modernization is the right choice, these approaches range from minimal changes to a complete rethink of your application.
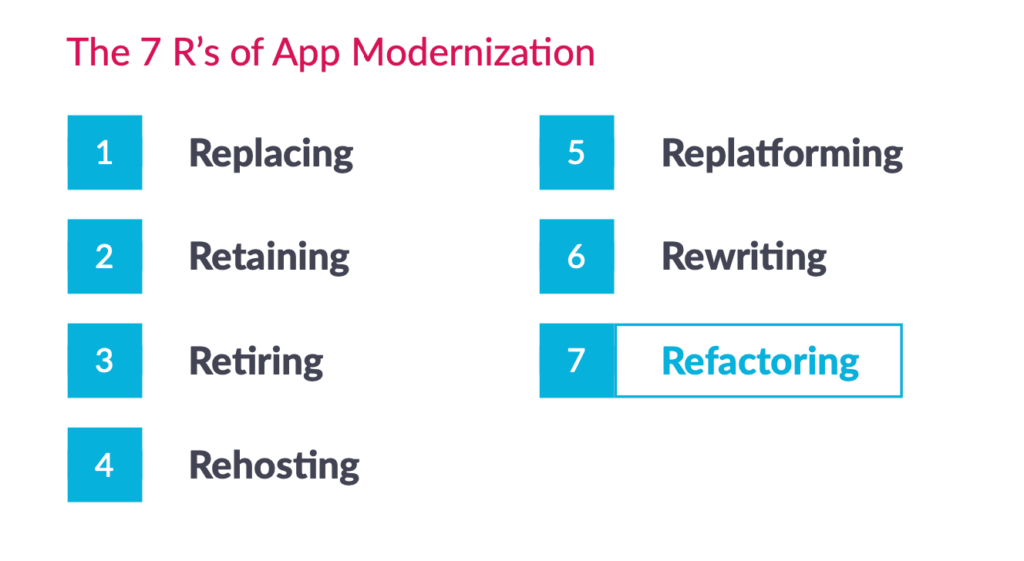
Replace
In some cases, replacing your legacy application with a commercial-off-the-shelf solution (COTS) or Software-as-a-Service (SaaS) offering might be the most practical path if the desired functionality exists in a packaged solution.
Retain
If an application functions reliably, delivers adequate business value, and has minimal interaction with other systems, it’s often best to leave it alone and focus modernization resources elsewhere while continuing to monitor for signs that action is required.
Retire
If a system clearly hinders innovation or constant maintenance strains resources, retiring it in a planned fashion and migrating essential data or functionality to modern replacements might be the best strategy.
Rehost (“Lift and Shift”)
This involves moving your application to a new infrastructure environment, often the cloud, while making minimal changes to the code itself. It’s a good choice for rapidly realizing the benefits of a modern cloud platform without a significant overhaul.
Replatform
With re-platforming, you adapt your application to a new platform, such as a different cloud provider, a newer operating system, or a newer version of the framework the app is built on. Limited code changes may be needed, but the core functionality remains intact.
Rewrite
In this scenario, you rewrite your entire application from the ground up using modern architectures and technologies. This is often the most intensive option, reserved for no longer viable systems or when complete innovation is the goal.
Refactor
This pattern focuses on restructuring an application’s codebase to enhance its design, maintainability, and performance. This could involve breaking a monolithic application into microservices or introducing new programming techniques, but overall, the application’s external behaviors remain the same.
Other common patterns
Beyond the options above, other common patterns can also be used for application modernization.
Incremental Modernization (The “Strangler Fig” Pattern)
Gradually strangle your monolithic application by systematically replacing its components with new, typically microservice-based, implementations. New and old systems operate side by side, enabling a controlled, risk-managed transition.
Containerization
Containerization encapsulates your application and its dependencies into self-contained units (virtual machines), often using technologies such as Docker and Kubernetes. These containers can run reliably across environments, boosting portability, application scalability, and deployment efficiency. This pattern lends itself particularly well to cloud migration.
In most cases, real-world application modernization involves strategically combining multiple patterns. Starting small and building upon initial successes can demonstrate value and gain organizational buy-in for your modernization roadmap. For the particulars on how to do this, let’s look at some critical pieces of a successful application modernization strategy.
Strategies for transforming legacy systems: the application modernization journey
As mentioned, implementing a successful application modernization strategy requires careful consideration and execution. Tailored strategies for Java modernization and .NET modernization can streamline this process by addressing the specific needs of these popular platforms. With this in mind, let’s look at essential application modernization strategies to streamline the process and maximize your outcomes.
Start with a thorough assessment
Before taking action to modernize existing apps, conduct a detailed assessment of your existing application landscape. Analyze individual applications, their architecture, dependencies, code quality, and alignment with your current business needs. This assessment will uncover the most pressing challenges and help you strategically prioritize reaching your target state.
Define clear goals
Articulate the specific reasons behind your modernization project. Are you aiming for improved agility, reduced costs, enhanced scalability, a better user experience, or a combination of factors? Having well-defined goals ensures that your modernization efforts stay focused and progress is tracked effectively.
Plan for incremental change
Avoid disruptive, “big bang” modernization projects whenever possible. Instead, break down the process into manageable increments. Identify functional components of the application that can be modernized independently. This iterative approach is the best way to mitigate risk and allows for early wins. It also helps to cultivate a culture and framework for continuous improvement.
Choose the right technologies
Modernization success hinges on the right technology choices. Carefully evaluate cloud services (including hybrid cloud and private cloud solutions), containerization software and technologies, microservice architectures, DevOps toolchains, and modern software frameworks. Select the tools and paradigms that align with your long-term vision and support the features you plan to build.
Invest in your people
Your development team must embrace new skills and approaches as part of the modernization journey. This requires organizations to provide opportunities for training and upskilling, ensuring that your team can effectively leverage new technologies you introduce.
Emphasize security from the start
Security must be a top priority throughout your modernization efforts and be a critical focus from the outset. Incorporate modern security frameworks and practices (such as the “shift-left” testing methodology), promote secure coding standards, and fully utilize any cloud-native security features your chosen platform provides.
While traditional software development principles apply, app modernization often benefits from a more specialized methodology. Techniques like domain-driven design (DDD) and continuous code refactoring offer valuable ways to understand, decompose, and iteratively modernize large, complex legacy systems. Proper planning, whether from a technology roadmap or human resources perspective, is critical to a successful modernization journey.
Essential technologies for advancing application modernization
Using modern tools and techniques is essential for legacy application modernization. As you move from legacy frameworks and infrastructure, here are a few key technologies that can help with modernization efforts.
- Cloud computing: Cloud platforms (IaaS, PaaS, SaaS) offer flexibility, scalability, and managed services, reducing the burden of on-premises infrastructure. For organizations that accelerate cloud adoption, it delivers cost savings, enables rapid deployment, and grants access to the latest innovations.
- Containers: Key application modernization tools include containerization platforms like Docker and Kubernetes. These platforms facilitate consistent deployment across environments and simplify the orchestration of complex multi-component applications. Containers are often central to microservice-based architectures, assisting with modular development.
- Microservices: Decoupling monolithic applications into smaller, independently deployable microservices can significantly improve agility and resilience in some cases. This approach allows for independent scaling and targeted updates, minimizing the impact of changes on the overall system.
- DevOps Tools and best practices: DevOps practices, supported by tools for continuous integration and deployment (CI/CD), configuration management, and infrastructure as code (IaC), increase the speed and reliability of software delivery. DevOps helps break down the barriers between development and operations, a critical factor in accelerating modernization through rapid delivery.
- Cloud-native data management: Modernizing your data storage and management approach is essential. Solutions like cloud-based data warehouses, data lakes, and high-performance databases are built for scale, enabling you to capitalize on your modernized application capabilities fully.
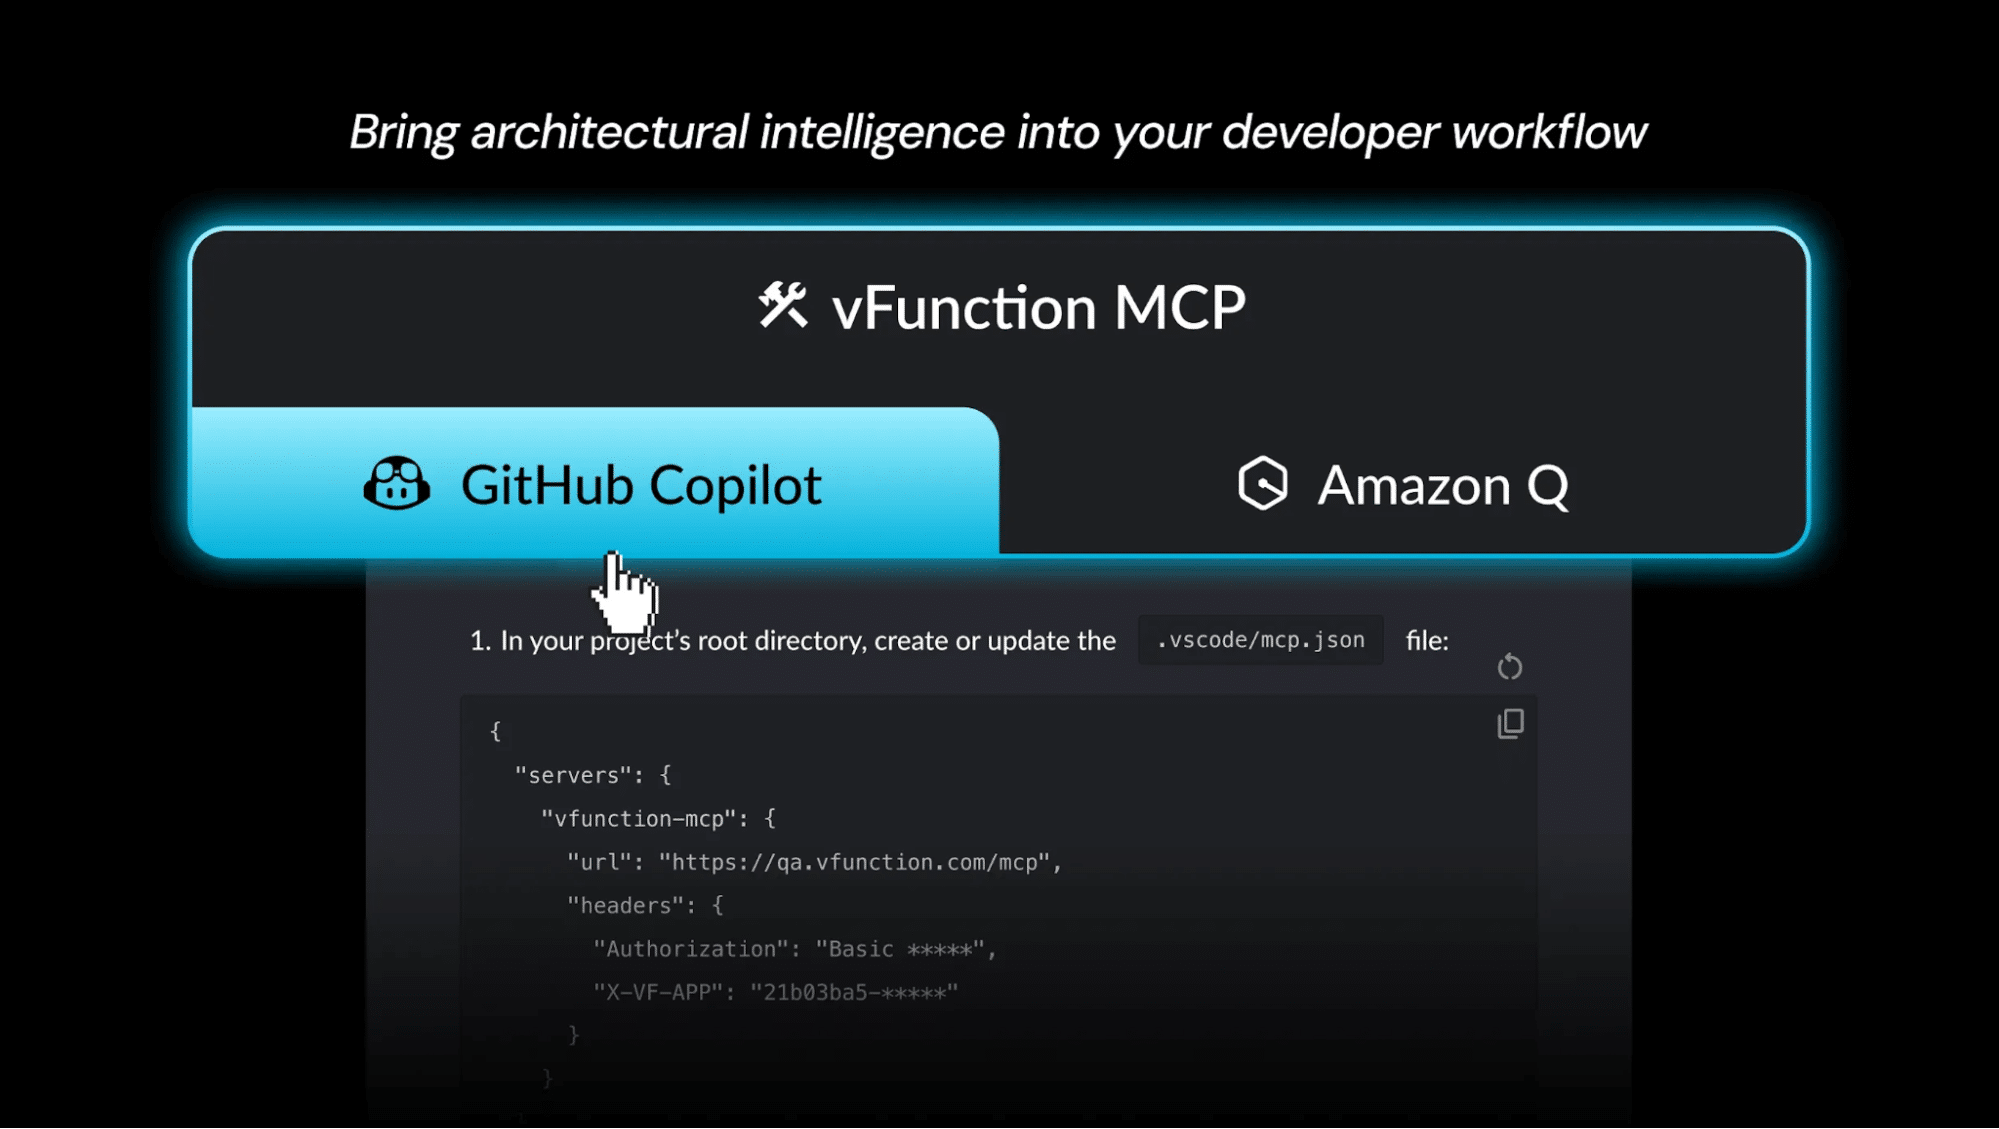
- Artificial Intelligence (AI) and Machine Learning (ML): With the latest advancements in AI and ML, integrating these technologies into your applications can automate tasks, deepen insights, personalize user experiences, and outpace the competition. It may also make sense to equip developers with the latest AI development tools, such as GitHub Co-Pilot, to improve developer productivity and speed up development cycles.
Selecting the methodologies and technologies for your modernization journey should be a strategic decision. The decisions should align with your business objectives, the nature of the applications being modernized, and your development team’s skills. A focused, customized approach to legacy application modernization ensures the highest return on investment in technology.
Hybrid cloud and application modernization
Many organizations find that hybrid cloud architectures provide the flexibility needed for gradual modernization. This approach allows you to keep sensitive or mission-critical applications on-premises or in private cloud environments while moving other workloads to public cloud platforms for improved scalability and cost efficiency.
Hybrid cloud strategies work particularly well for incremental modernization. You can migrate applications in stages, reducing risk while maintaining business continuity. Teams can leverage modern cloud services and tools without disrupting existing operations, making the transition more manageable for both technical and business stakeholders.
This flexibility extends to data management as well. Organizations can maintain control over their most sensitive data while still leveraging cloud-native capabilities such as auto-scaling, managed services, and advanced analytics. For enterprises with regulatory requirements or data sovereignty concerns, hybrid cloud offers a practical path forward.
The key advantage is choice. Rather than forcing all applications into a single deployment model, hybrid cloud lets you match each workload to the infrastructure that best meets its specific requirements, sensitivity, and business value.
Overcoming common challenges in application modernization
While modernization delivers significant benefits, organizations often encounter obstacles that can derail their efforts. Here’s how to address the most common challenges:
Organizational resistance remains one of the biggest hurdles. Teams comfortable with existing systems may resist change, especially if they’ve built deep expertise in legacy technologies. Address this by communicating transparently about why modernization is necessary, involving skeptics in the planning process, and demonstrating early wins that show tangible benefits. Education and training are essential—invest in upskilling your team rather than expecting them to learn everything on their own.
Managing technical complexity requires realistic expectations and the right tools. Legacy systems often have undocumented dependencies and years of accumulated workarounds. Use automated analysis tools to map dependencies and identify separation boundaries. Don’t expect to understand everything upfront—document as you go and embrace an iterative approach that allows for course correction.
Balancing modernization with ongoing development can strain resources. Avoid trying to modernize everything at once. Instead, adopt incremental strategies that allow teams to continue delivering business value while gradually improving the architecture. This sustained approach reduces risk and maintains organizational momentum better than attempting large-scale transformations.
Measuring success in application modernization
Effective measurement requires tracking both technical and business metrics. Here’s what to focus on:
Technical metrics
- Deployment frequency: How often can you safely deploy changes?
- Lead time: How long from code commit to production?
- Mean time to recovery (MTTR): How quickly can you fix issues?
- Change failure rate: What percentage of changes cause problems?
- Test coverage: Are automated tests catching issues before production?
- Technical debt reduction: Are you reducing complexity over time?
Performance metrics
- Application response times: Are users experiencing faster load times?
- Scalability improvements: Can the application handle more load with fewer resources?
- Infrastructure costs: Are cloud or hosting costs decreasing?
- Resource utilization: Are you making better use of compute and memory?
Security metrics
- Vulnerability count: Are you reducing known vulnerabilities?
- Time to patch: How quickly can you apply security updates?
- Security incidents: Have breaches or incidents decreased?
- Compliance status: Are you meeting regulatory requirements more easily?
Business metrics
- Development velocity: Are teams shipping features faster?
- Feature adoption: Are users benefiting from new capabilities?
- Customer satisfaction: Have CSAT or NPS scores improved?
- Revenue impact: Is modernization enabling new revenue opportunities?
- Maintenance costs: Are you spending less on keeping the lights on?
Establish baselines before modernization to demonstrate concrete improvements. Review metrics regularly and adjust your approach based on the data. Even though your current modernization effort may be a “project”, remember that modernization is an ongoing process. This means that your measurement strategy should reflect this reality.
Application modernization for enterprises
For enterprises, application modernization is a strategic undertaking. Extensive application portfolios, complex business processes, and the need for governance necessitate a well-planned approach. Building a strong business case is vital to secure executive buy-in. Highlight the ROI, cost savings, competitive edge, and risk mitigation modernization offers. A phased approach, starting with smaller, high-impact projects, allows for refining processes as the program scales. Change management is also crucial; proactive communication, training, and cross-functional collaboration ensure a smooth transition.
Enterprise modernization often necessitates a hybrid approach, maintaining legacy systems while modernizing others. A well-defined integration strategy is key to seamless functionality during the transition. Clear guidelines, architectural standards, and ongoing reviews maintain consistency and reduce long-term maintenance challenges. Enterprise architects can define the desired target state and iterate on a transformation roadmap. Strategic partnerships with vendors can provide valuable expertise and resources. Finally, recognize that not every legacy application requires immediate modernization. A thorough assessment helps prioritize efforts based on business impact. Focus on the areas where modernization will yield the greatest results and align efforts with the enterprise’s overall goals.
How vFunction can help with application modernization
Understanding your existing application’s current state is critical to determining whether it needs modernization and the best path to modernize it. This is where vFunction becomes a powerful tool, simplifying and informing software developers and architects about their existing architecture and the possibilities for improving it.
Let’s break down how vFunction aids in this process:
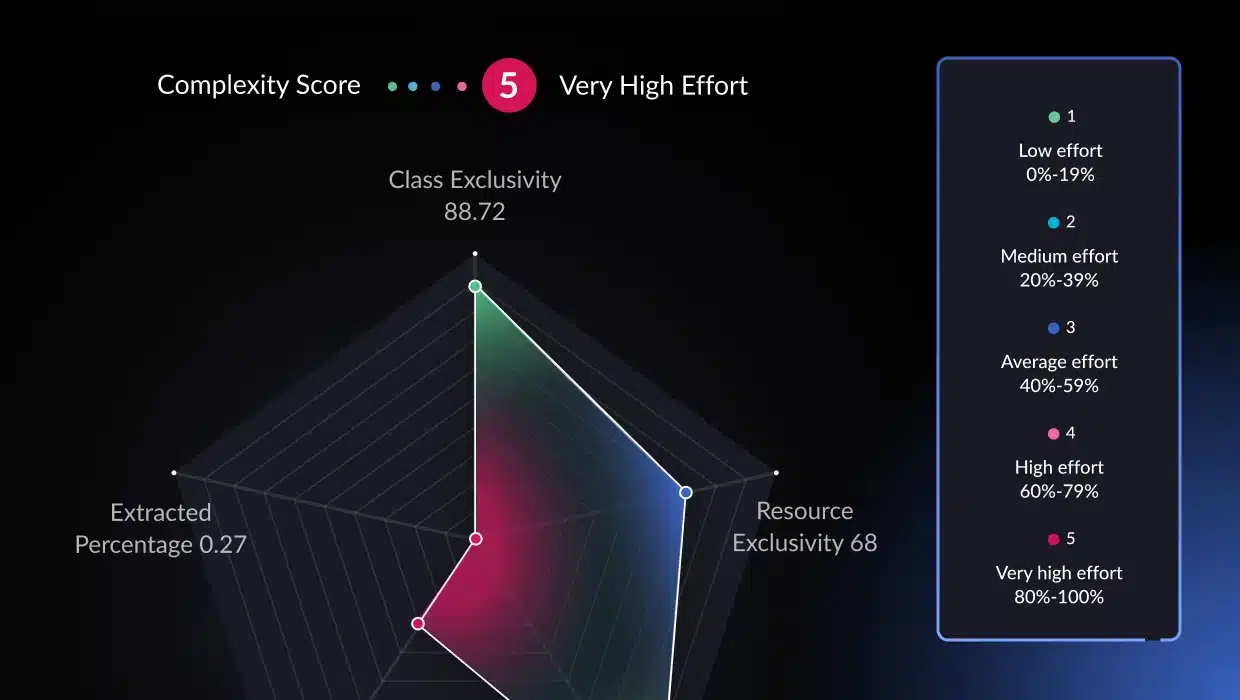
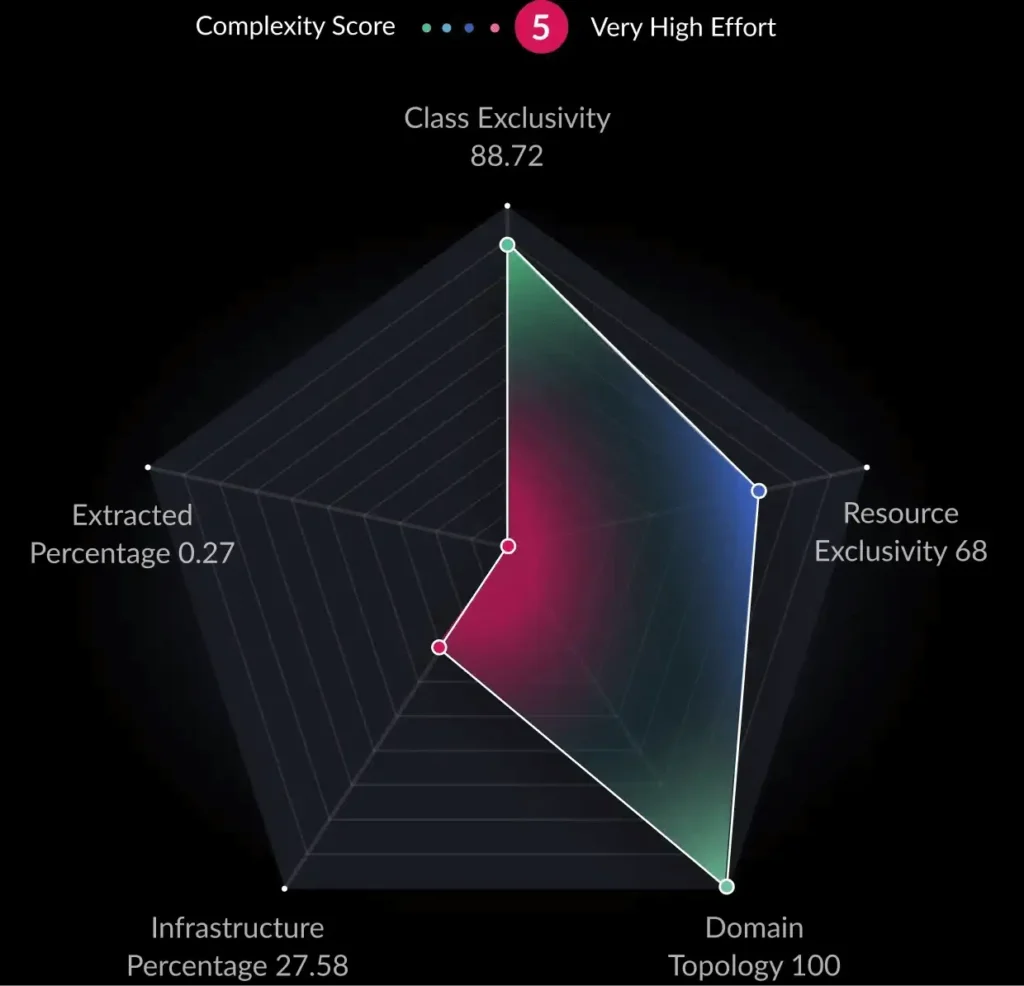
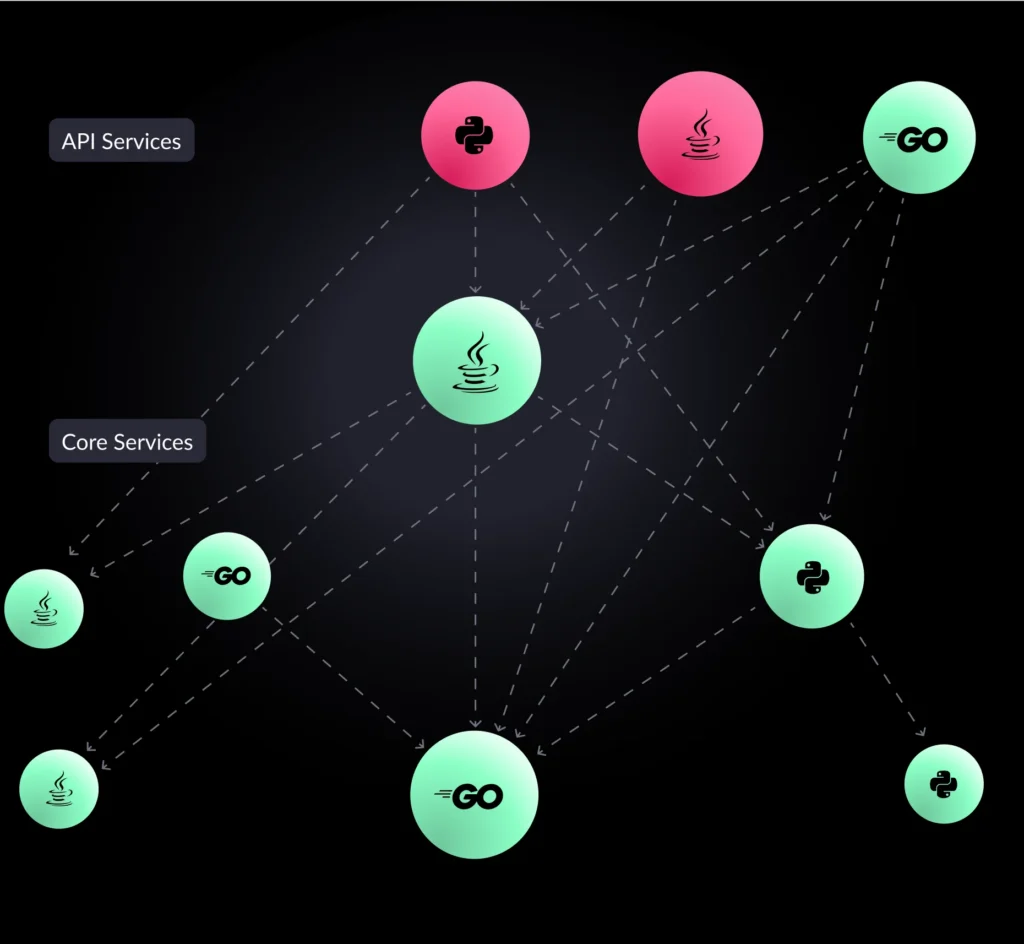
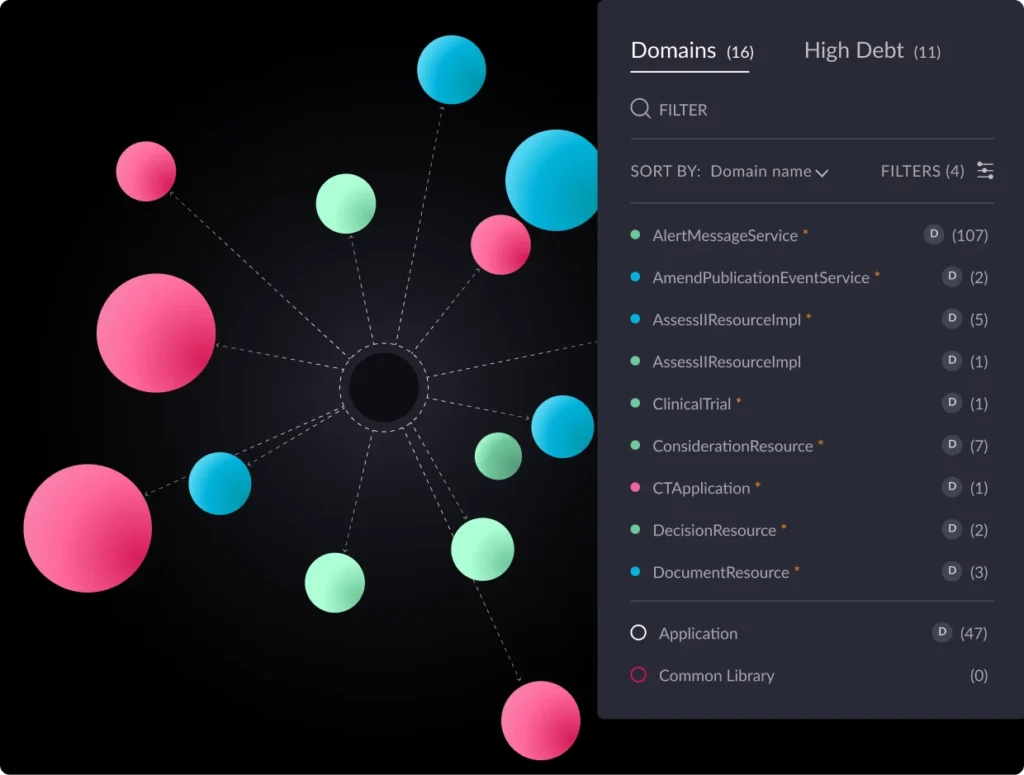
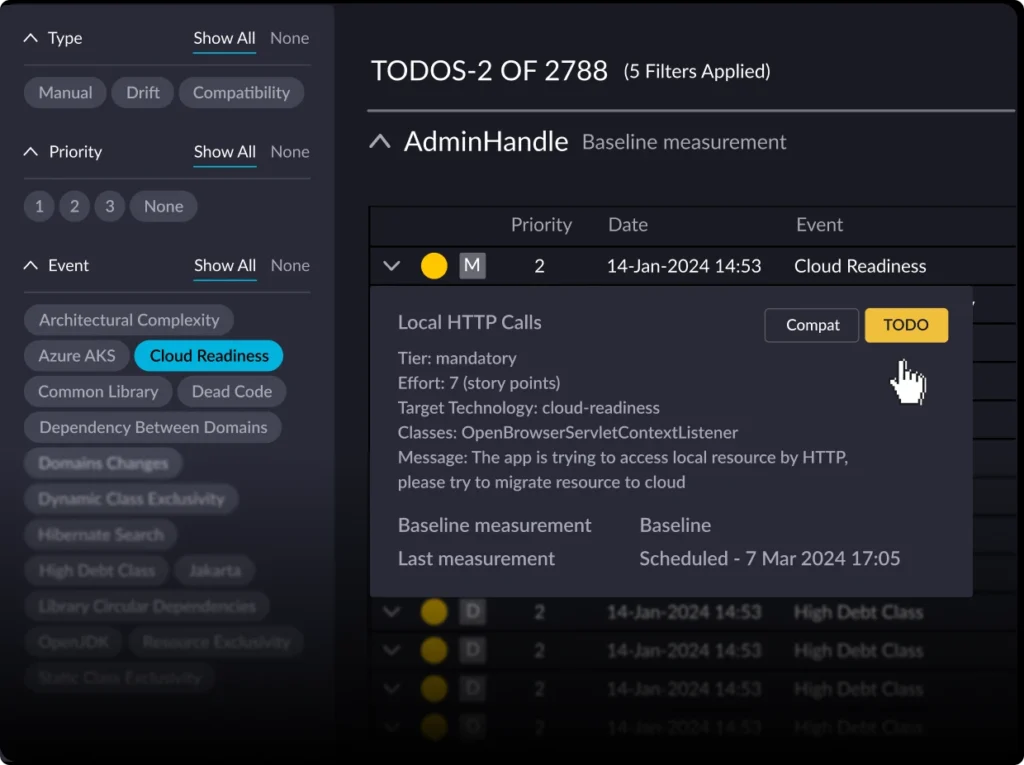
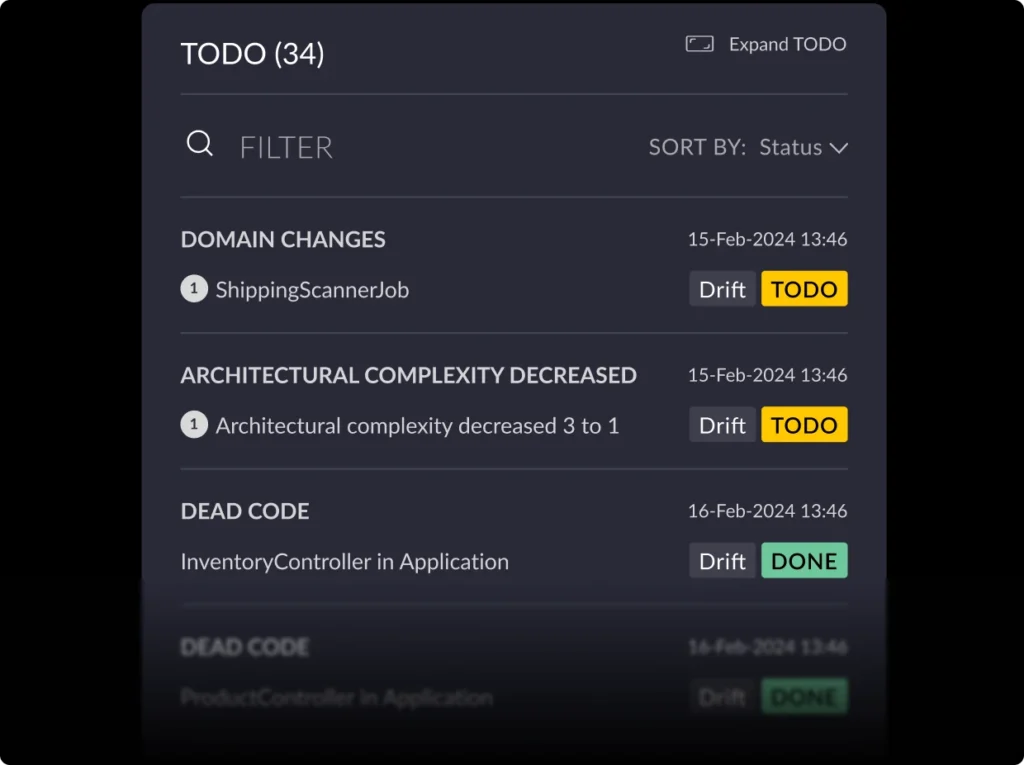
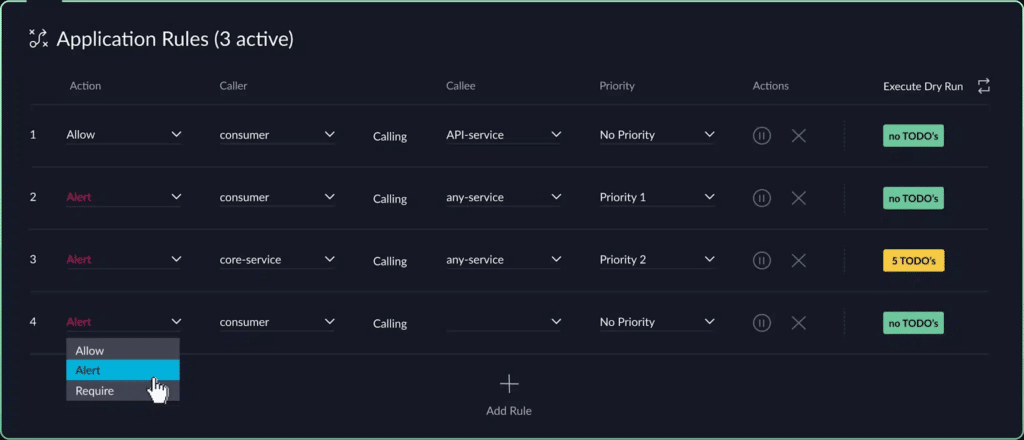
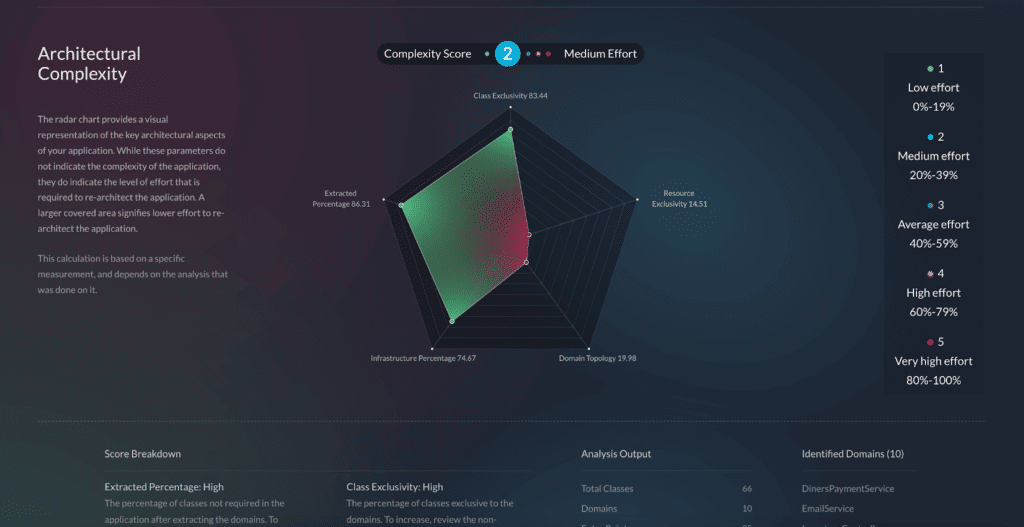
- Automated analysis and architectural observability: vFunction begins by deeply analyzing an application’s codebase, including its structure, dependencies, and underlying business logic. This automated analysis provides essential insights and creates a comprehensive understanding of the application, which would otherwise require extensive manual effort to discover and document. Once the application’s baseline is established, vFunction kicks in with architectural observability, allowing architects to observe how the architecture changes and drifts from the target state or baseline. As application modernization projects get underway, with every new code change, such as adding a class or service, vFunction monitors and informs architects, allowing them to observe the overall impacts of the changes.
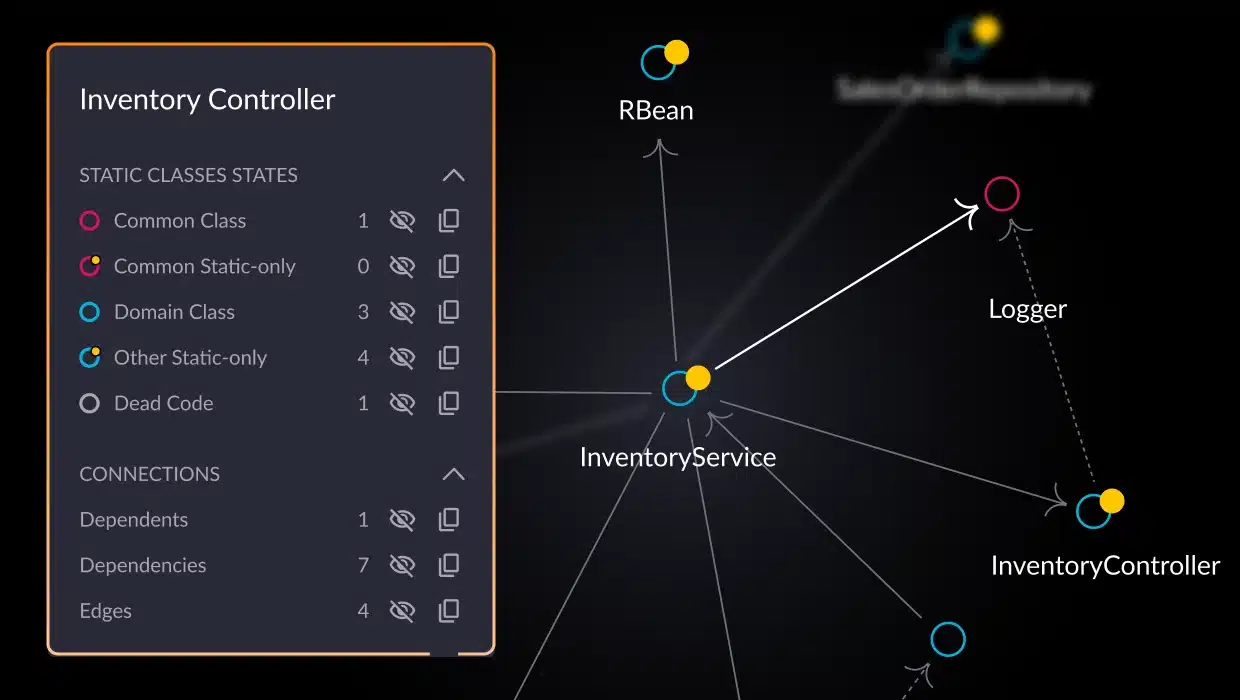
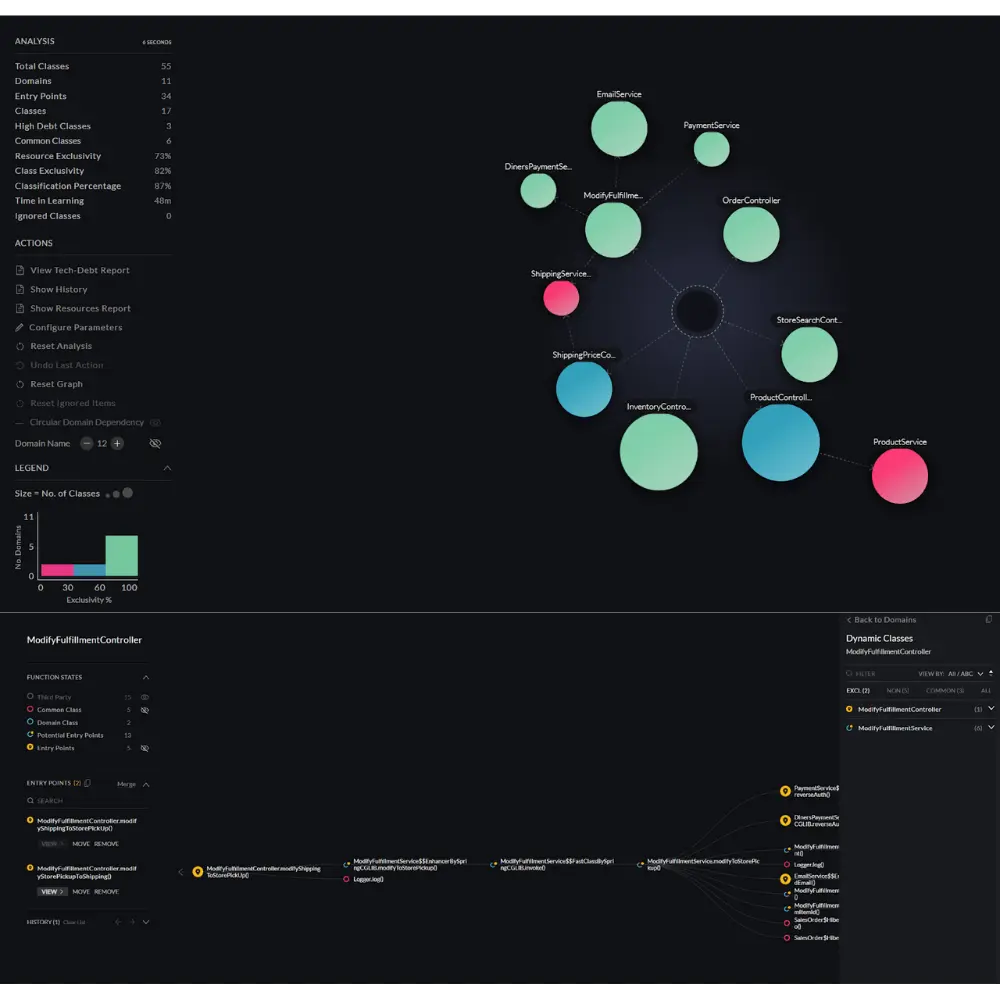
- Identifying microservice boundaries: If part of your modernization efforts is to break down a monolith into microservices, vFunction’s analysis aids in intelligently identifying domains, a.k.a. logical boundaries, based on functionality and dependencies within the monolith, suggesting optimal points of separation.
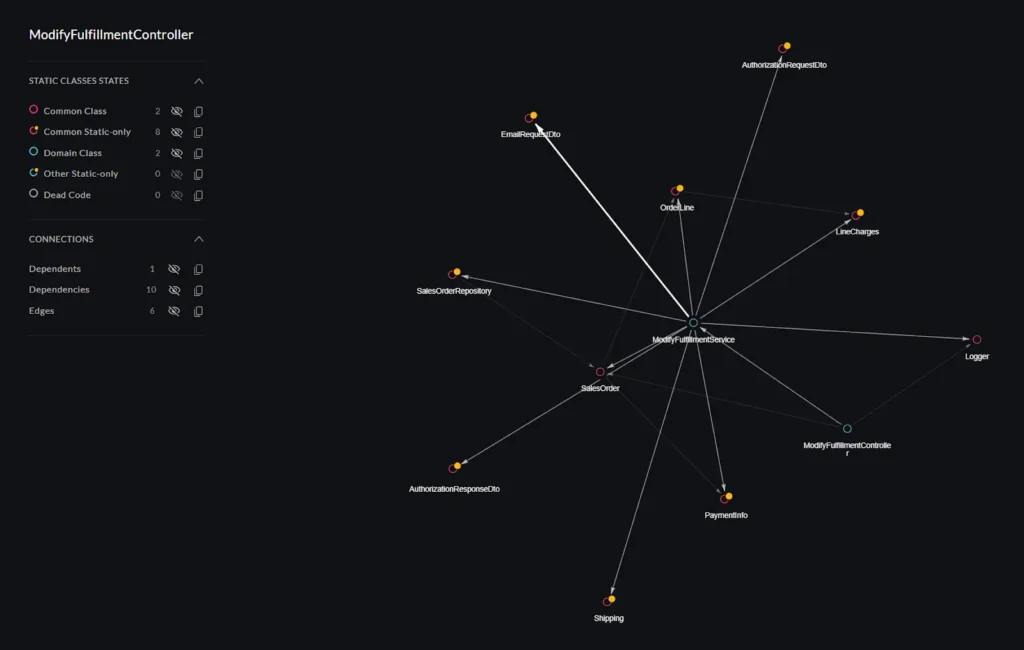
- Extraction and modularization: vFunction helps extract identified components within an application and package them into self-contained microservices. This process ensures that each microservice encapsulates its own data and business logic, facilitating a gradual move towards a modular architecture. Architects can use vFunction to modularize a domain and leverage Code Copy to accelerate microservices creation by automating code extraction. The result is a more manageable application that is moving towards your target-state architecture.
Key advantages of using vFunction
- Engineering velocity: vFunction dramatically speeds up the process of improving an application’s architecture and modernizing it, such as moving monoliths to microservices if that’s your goal. This increased engineering velocity translates into faster time-to-market for products and features, as well as a modernized application.
- Increased scalability: By helping architects view their existing architecture and observe it as the application grows, scalability becomes much easier to manage. By understanding the application’s landscape and improving the modularity and efficiency of each component, scaling becomes more manageable.
- Improved application resiliency: vFunction’s comprehensive analysis and intelligent recommendations increase your application’s resiliency and architecture. By understanding how each component is built and how it interacts with the others, informed decisions can be made to prioritize resilience and availability.
Conclusion
Legacy applications can significantly impede your business agility, innovation, and competitiveness. Application modernization is the key to unleashing the full potential of your technology investments and driving your digital transformation forward. But application modernization doesn’t have to be a clear-the-decks, project-based approach. By following application modernization best practices and using vFunction architectural observability, companies can understand their architecture, pinpoint sources of technical debt and top modernization opportunities, and plan incremental modernization of legacy applications as part of the regular CI/CD process. By embracing modern architectures, cloud technologies, and a strategic approach, application modernization can be a successful and worthwhile investment.
Ready to start your application modernization journey? vFunction is here to guide you every step of the way. Our platform, expertise, and commitment to results will help transition into a modern, agile technology landscape.